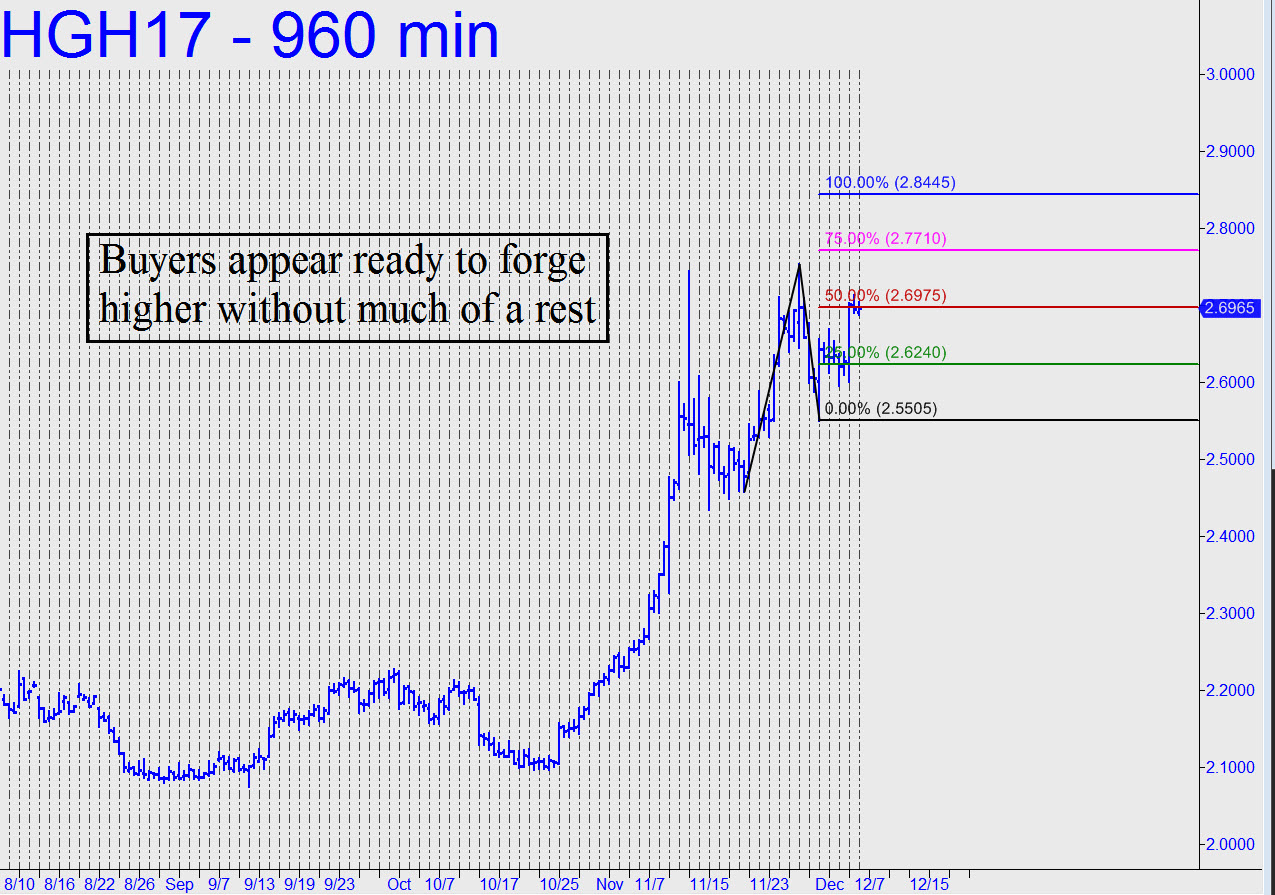
 Doc Copper has swung wildly since November’s moon shot and seems likely, on the visual evidence of the charts, to attempt another spectacular leap. Assuming the gyrations of the last three weeks have been a consolidation for a follow-through rally, notice that much of the action has taken place just beneath the November peak. That bulls mean business is further affirmed by the slight penetration of the November peak on the second run-up. However, unless it is the return of severe inflation that copper is predicting, the correction will probably need to take out the key low at 2.4260 (see inset) to give a second-wind rally some running room. Although I doubt that serious inflation is possible in an economic world that has amassed debts aggregating to more than a quadrillion dollars, I will let the chart speak for itself in the weeks and months ahead. In the meantime, for trading purposes, the sale of option straddles targeted on the 2.50 strike seems like a good bet. _______ UPDATE (Dec 5, 8:22 p.m. ET): I’ve updated the chart to show the March contract, which harbors no evidence of buyer fatigue. Although Monday’s rally failed to breach the 2.6975 midpoint pivot decisively, the shallow correction from the highs implies more upside is coming, and soon — presumably to the 2.8445 target at least. _______ UPDATE (Dec 8, 9:52 p.m.): The futures are on a 2.6405 buy signal with the potential to reach, most immediately, 2.7245. First, though, they’ll need to get past the 2.6685 midpoint Hidden Pivot that contained today’s fleeting spike. _______ UPDATE (Dec 12. 9:48 a.m.) Sunday night’s bull-trap short–squeeze pushed the futures past p=2.6685 of the pattern noted above, allowing traders to exit half of the position profitably. If you’re still aboard, use a stop-loss one tick below the break-even price, 2.6125, for the two contracts that remain. _______ UPDATE (Dec 15): We scratched the trade when the futures sold off the next day.
