
 Since November, I’ve been at pains to reconcile my extremely bullish technical forecast with a gut feeling that the U.S. economy and the stock market are hurtling toward disaster. The housing cycle has peaked, a farm bust looms, big investors are starting to exit the bubble they created in commercial real estate, auto manufacturers will be going up against a record year, and bullish investor sentiment is at a generational extreme. Despite all of this, I’ve learned to trust my charts above all. And that’s why I’ve stuck for months with a forecast calling for a 1200-point rally on top of the nearly 1000-point rally that occurred in the days after the election. By no stretch am I able to imagine what could be the cause of such a powerful move. Although I have little doubt that the deregulated environment Trump has promised us will significantly benefit business, the stock market would seem to have discounted the most bullish outcome any investor could hope for.
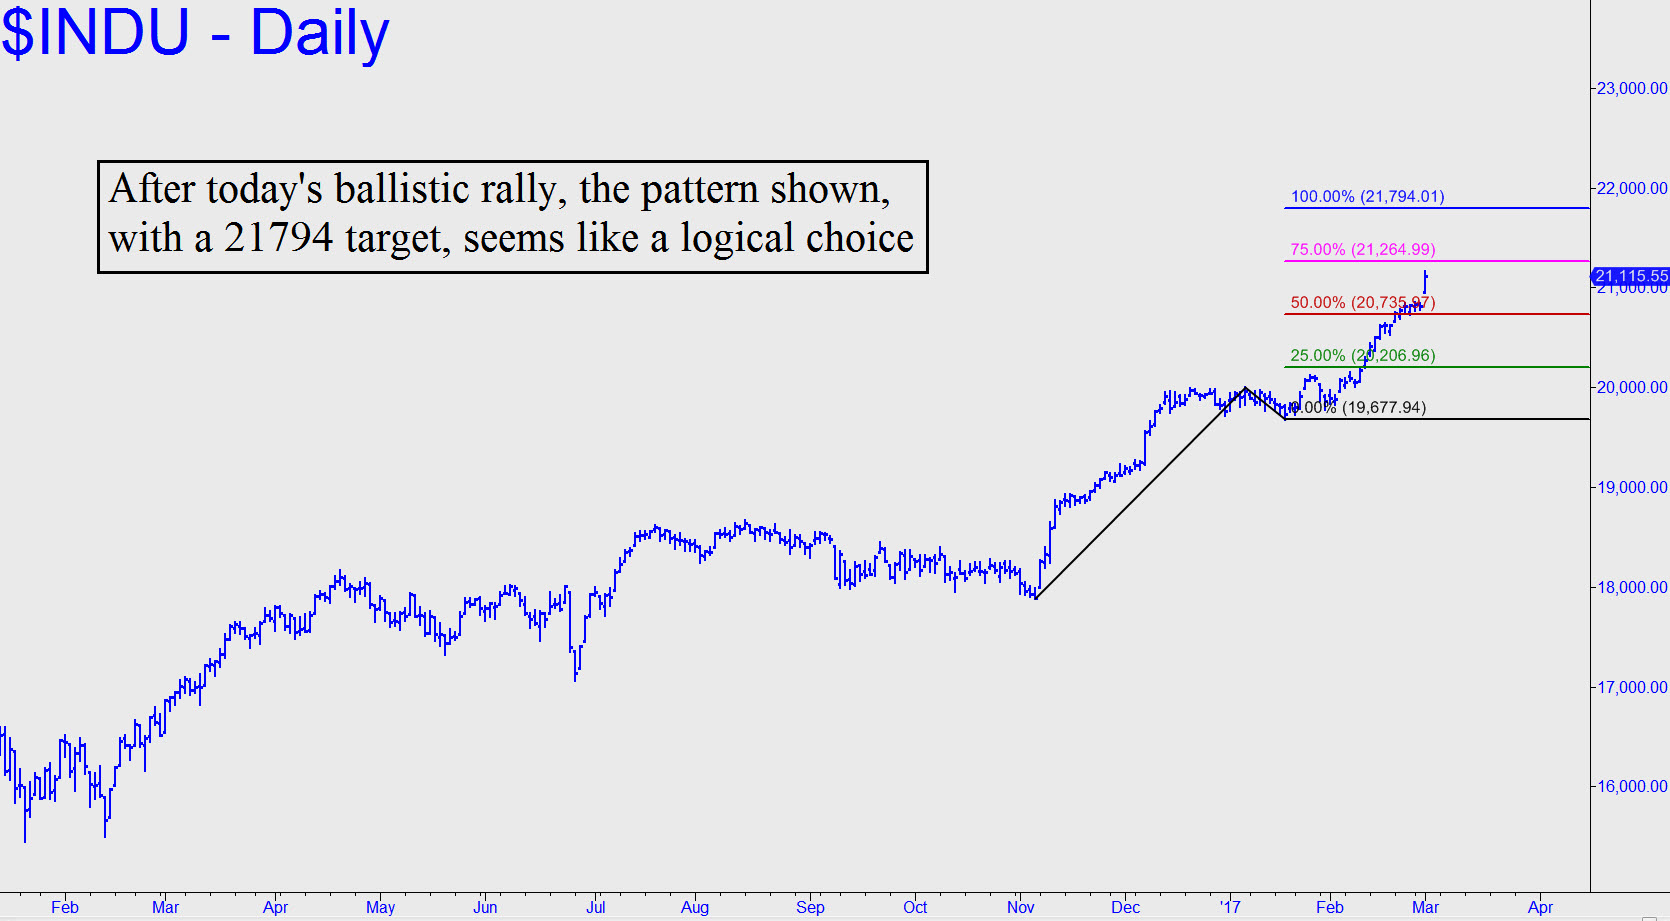
Even under the best of circumstances, with Democrats and Republicans miraculously working together to implement Trump’s economic policies as quickly as possible, it could still take a year or longer for those policies to have a significant and lasting effect. Despite all of this, my forecast that the Dow will exceed 21,000 is slowly coming true without the benefit of any spectacular rallies. The move has been rather unspectacular, actually, having occurred in the form of tedious stretches lasting for weeks, punctuated by intervals lasting for a week or two where the Dow racks up modest gains of perhaps 100 to 150 points per day. We’re in one of those intervals now, and it feels almost as though nothing could cause the trend to reverse, at least not for more than a day or two. It always feels that way at important tops, and so that’s why I am keeping a very close eye on the lesser charts. My Dow target at 21,049 (see inset) can stand, but if I start seeing downtrending abcd corrections on the lesser charts exceed their ‘d’ targets I will sound the alarm. Bullish as I am for technical reasons, I have one foot on the fire escape. Although I have no illusions about getting short at the exact top, neither do I want my subscribers to be caught ‘all-in’ when the market gets there. _______ UPDATE (Feb 20): In my latest E-Mini S&P tout, I’ve noted that the 21049 target given above corresponds very closely to one at 2403.30. The implication is that a major top is close at hand — either that, or bulls are about to lay waste to yet one more clear and compelling Hidden Pivot resistance. Regardless, I am making this tout viewable only for paying subscribers, since we want these Hidden Pivot targets to work their magic without interference and hubris from the many lurkers who visit this page. _______ UPDATE (Mar 1, 11:25 p.m.): Buyers laid waste to the 21,049 target, so we’ll use the pattern shown to generate a higher one. It says the Indoos are extremely likely to hit 21794 before bulls are spent. We may be able to squeeze off a ‘mechanical’ buy on a proper pullback, so stay tuned to the chat room in the days ahead for guidance in real time.