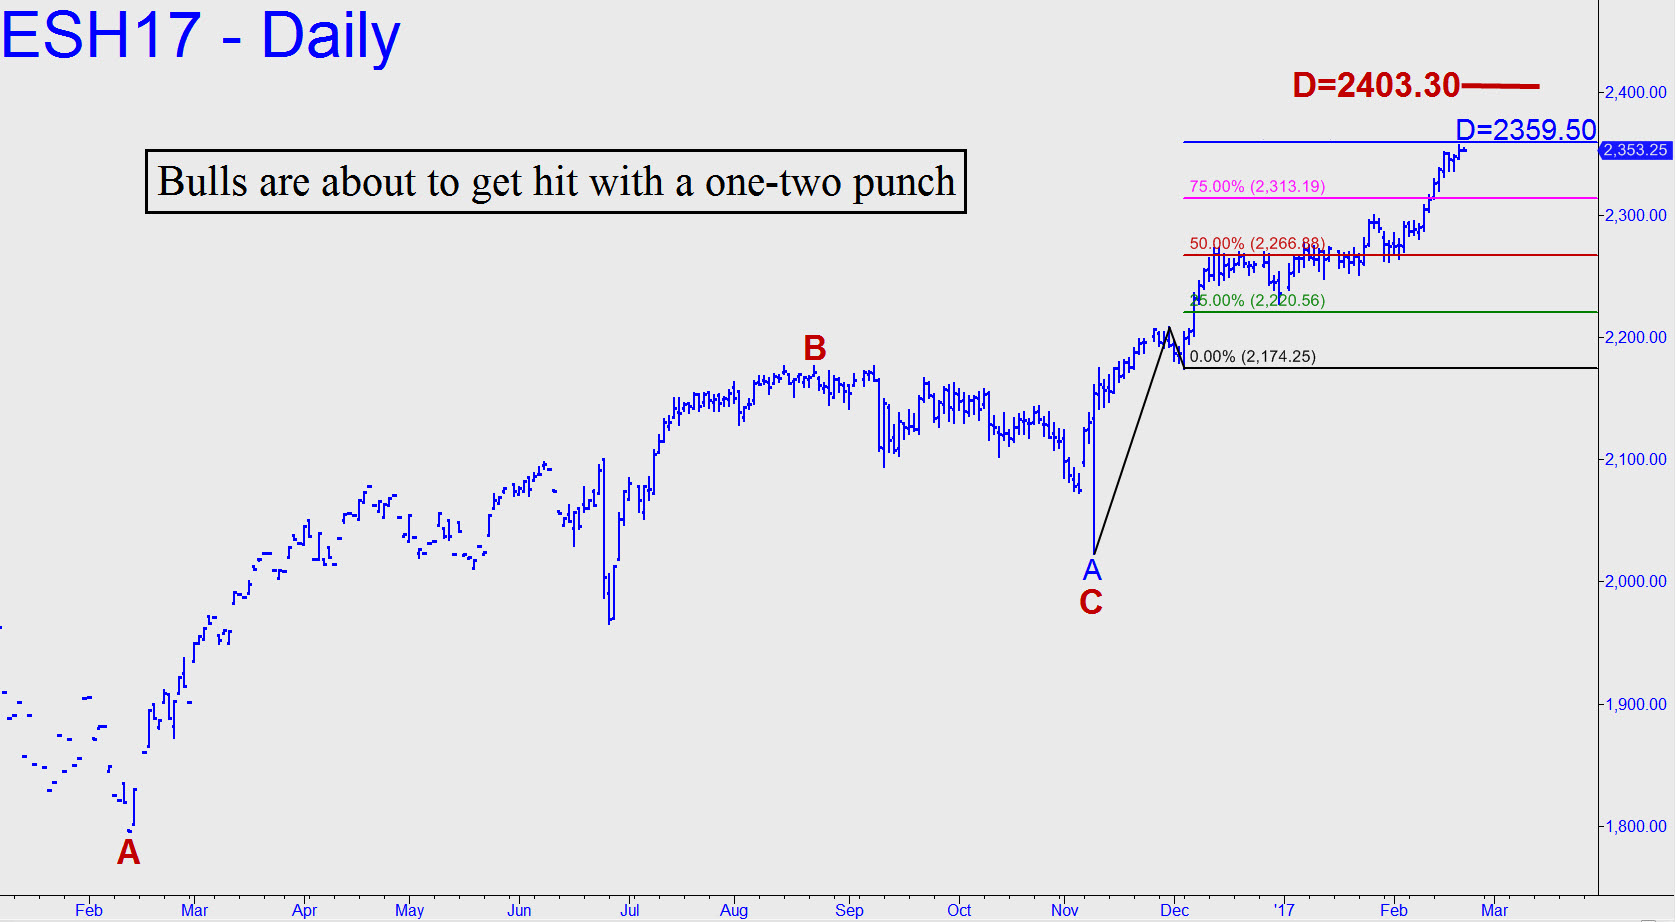
 There are two interesting Hidden Pivot resistances above these levels — interesting because one of them has the potential to douse February’s buying spree, the other quite possibly to end a bull market that in March will enter its ninth year. To give my targets the best chance of working precisely, I will not be sharing these numbers with anyone who is not a paying subscriber. Which is to say, we are about to “go dark” at these critical levels. The first resistance lies at 2359.50, a hair above where the futures topped this morning during holiday-shortened hours. The chart shows why I am watching this number closely even though the higher target stands to be a bigger deal. Notice how the futures played hokie-pokey with the red line for nearly two months before finally taking off. This has confirmed the pattern itself and its target. My expectation is that the target will be surmounted, making a further ascent to 2403.30 about as certain as an ostensibly unpredictable event could be. The interesting thing about the second number is that it coincides very closely with the 21,049 target I’ve been using for the Dow Industrials. As always, I will reserve judgment about the bull market’s ongoing health until I’ve seen how buyers interact with these two Hidden Pivot resistance points. You should therefore consider this tout a heads-up to prepare yourselves for a potentially important price reversal. Alternatively, if so daunting a ‘hidden’ resistance as 2403.30 is easily brushed aside, we would need to re-imagine what this bull market is capable of. _______ UPDATE (Feb 21, 9:51 p.m. EST): Next minor stop on the way up: 2368.00. On the 60-minute chart, here are the relevant coordinates: A=2337.75 (2/17); B= 2356.75 (2/20); and C= 2349.00. And yes, for night owls the pullback to p=2359.50 is a mechanical buy, stop 2356.50. _______ UPDATE (Feb 22, 10:17 p.m.): Two wretched thrusts brought the futures to within three points of the 2368.00 target. Ordinarily, I’d suggest a ‘mechanical’ bid on the pullback to the red line (2258.50), stop 2255.25. However, because buyers have struggled so mightily to reach an ostensibly easy target, I’ll recommend simply observing this gambit from the sidelines and filing the results for future use. _________ UPDATE (Feb 23, 10:52 a.m.) ES has plummeted 11 points this morning after topping within two ticks of the 2368.00 target given above. Anyone trading this lamb chop? Please let me know in the chat room if you are.
