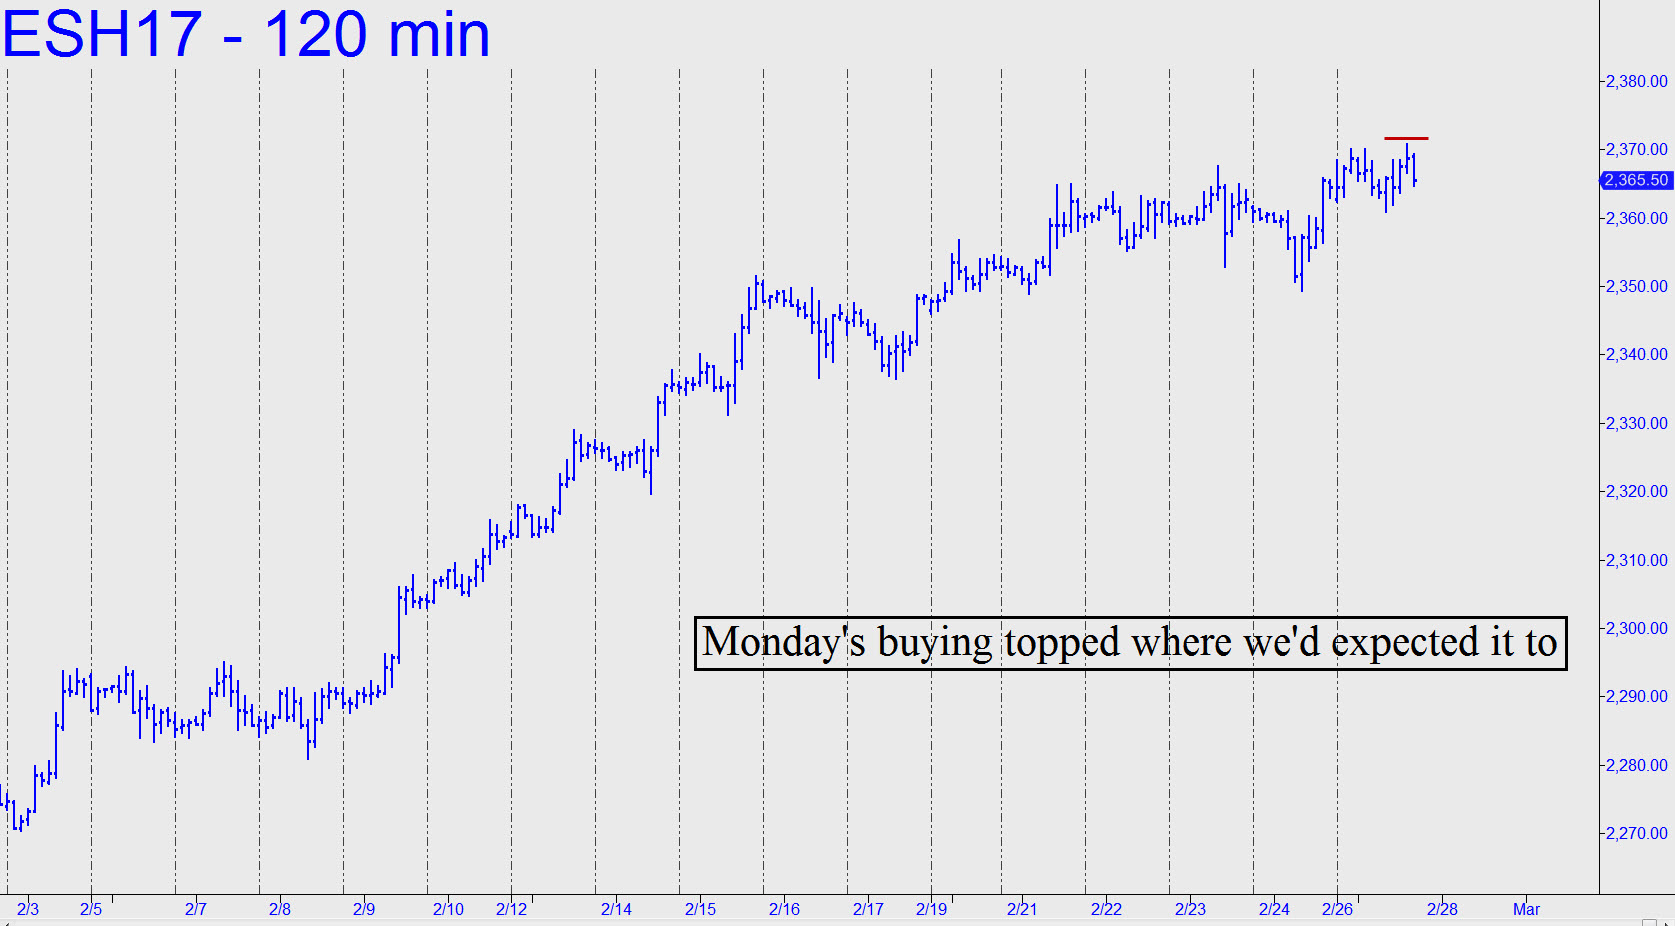
 You already know where the important targets lie, but you can check the archive for the previous tout just to be sure. Meanwhile, I’ll stick with little stuff in daily updates such as this one, since this supposedly tricky vehicle has been as predictable lately as a pair of loaded dice. On Thursday, for instance, it topped in the opening minutes two ticks beneath the 2368.00 target I’d sent out the previous night. The subsequent plunge, as gratuitous as a plantar wart, could have been worth as much as $700 to anyone who caught the move. The equally gratuitous rally into the close served only to keep those who might otherwise have fallen into peaceful slumber on their guard for Friday. You can use the 2371.50 target shown in the chart to make tradable sense of things, but night owls may have another option: Bidding 2358.75, stop 2357.75 to bottom-fish at a promising midpoint Hidden Pivot support. On the 15-minute chart, here are the coordinates: a=2367.50; b=2353.00; and c=2365.00. ________ UPDATE (Feb 26, 7:51 p.m. EST): 2371.50 is still exactly where the little sonofabitch is headed — and yes, the pullback Sunday night to within a single tick of p=2362.50 was most surely a ‘mechanical’ buying opportunity for night-owls. The set-it-and-forget-it stop-loss would have been at 2359.25, risking a theoretical $160 per contract (rounded) for a shot at $462. _______ UPDATE (Feb 27, 5:54 p.m.): Buyers ran out of steam three ticks shy of the 2371.50 target flagged above (see inset, a new chart). Although that’s less than a point, it’s still enough for us to infer possible weakness over the next day or two, if not longer. The selling would begin to look serious if it exceeds 2349.00 to the downside on Tuesday.
