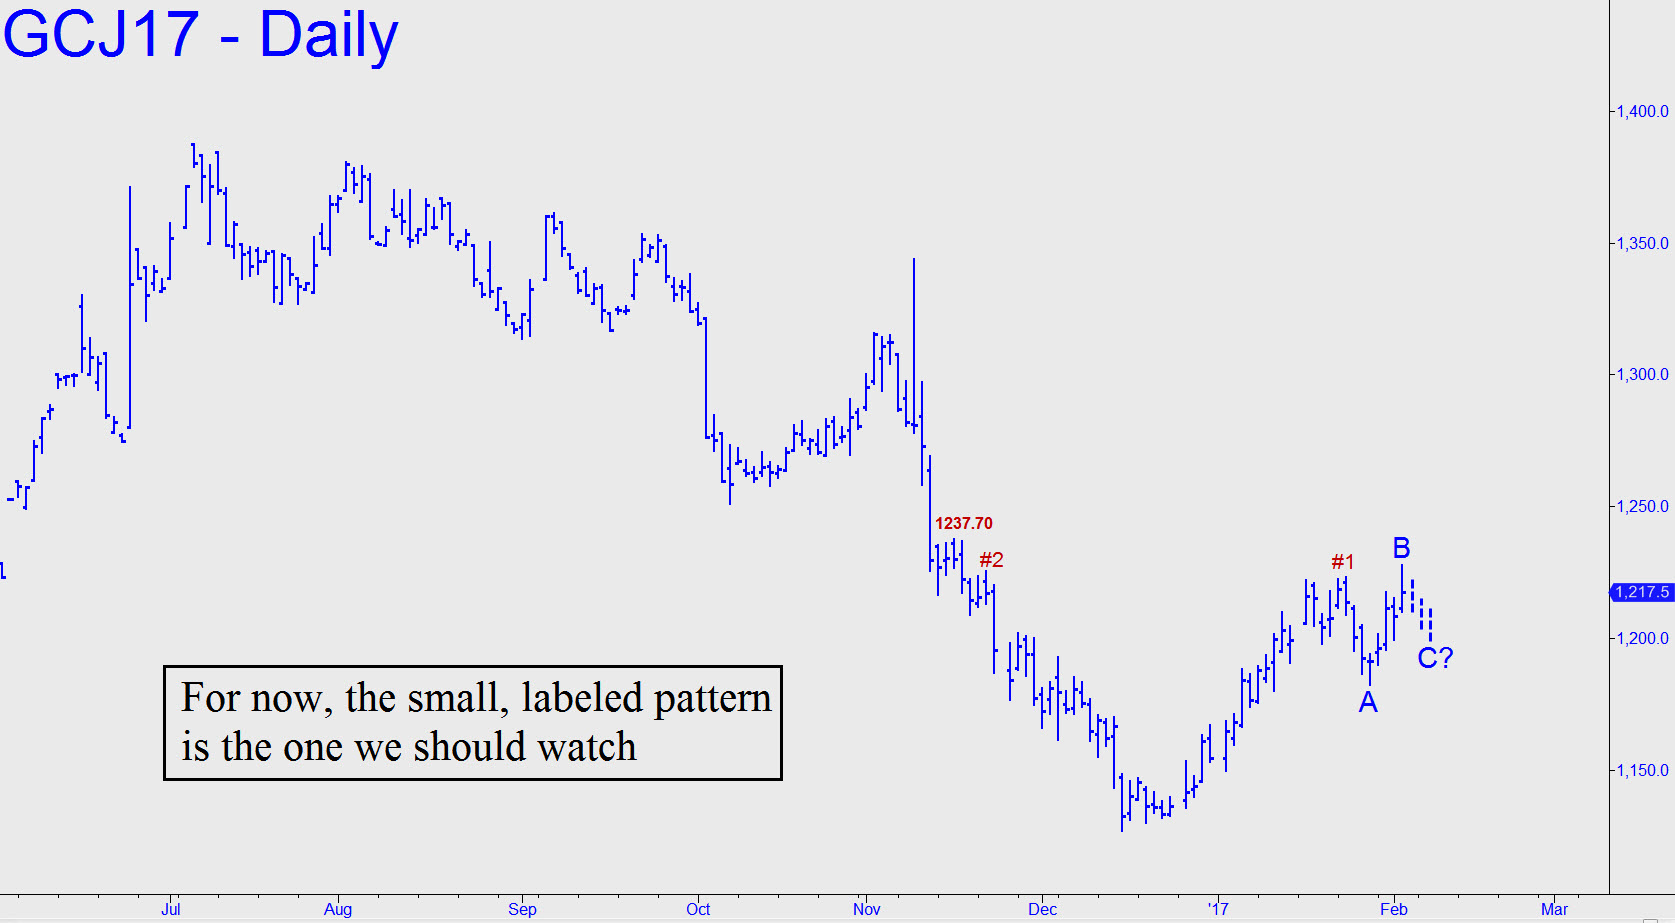
 After rallying sharply overnight, the futures fell $6 from within a single tick of the 1219.10 Hidden Pivot I’d flagged here earlier. A second-wind burst took them even higher, to an intraday peak at 1227.50 that easily beat my bullish ‘continuation’ benchmark at 1223.00. This is constructive action, and we should regard any retracement that doesn’t breach January 27’s 1182.60 low as a potential buying opportunity. Even so, I’ve selected the most conservative rally pattern available (see inset) so that we can accurately gauge the strength of the rally and trade it knowledgeably. The A-B leg shown exceeded the 1225.50 peak, making it bullishly impulsive. This cannot be said of the bigger-picture rally leg, however, since its January 24 peak at 1223.00 missed being ‘impulsive’ by 60 cents. We’ll see how it goes on Friday, but if the trend pushes above the 1237.70 peak without correcting, that would be reason for bulls to relax. _______ UPDATE (Feb 5, 6:15 p.m.): No change. Continue to use the small pattern shown to extrapolate day-tradable information. In theory, the futures would need to retrace down to at least 1202.50 to be considered properly rested for another leg up. In practice, however, if buyers were to push this vehicle above the 1237.70 peak (see inset) without a full retracement, it would increase the imputed bullishness of the daily chart.
