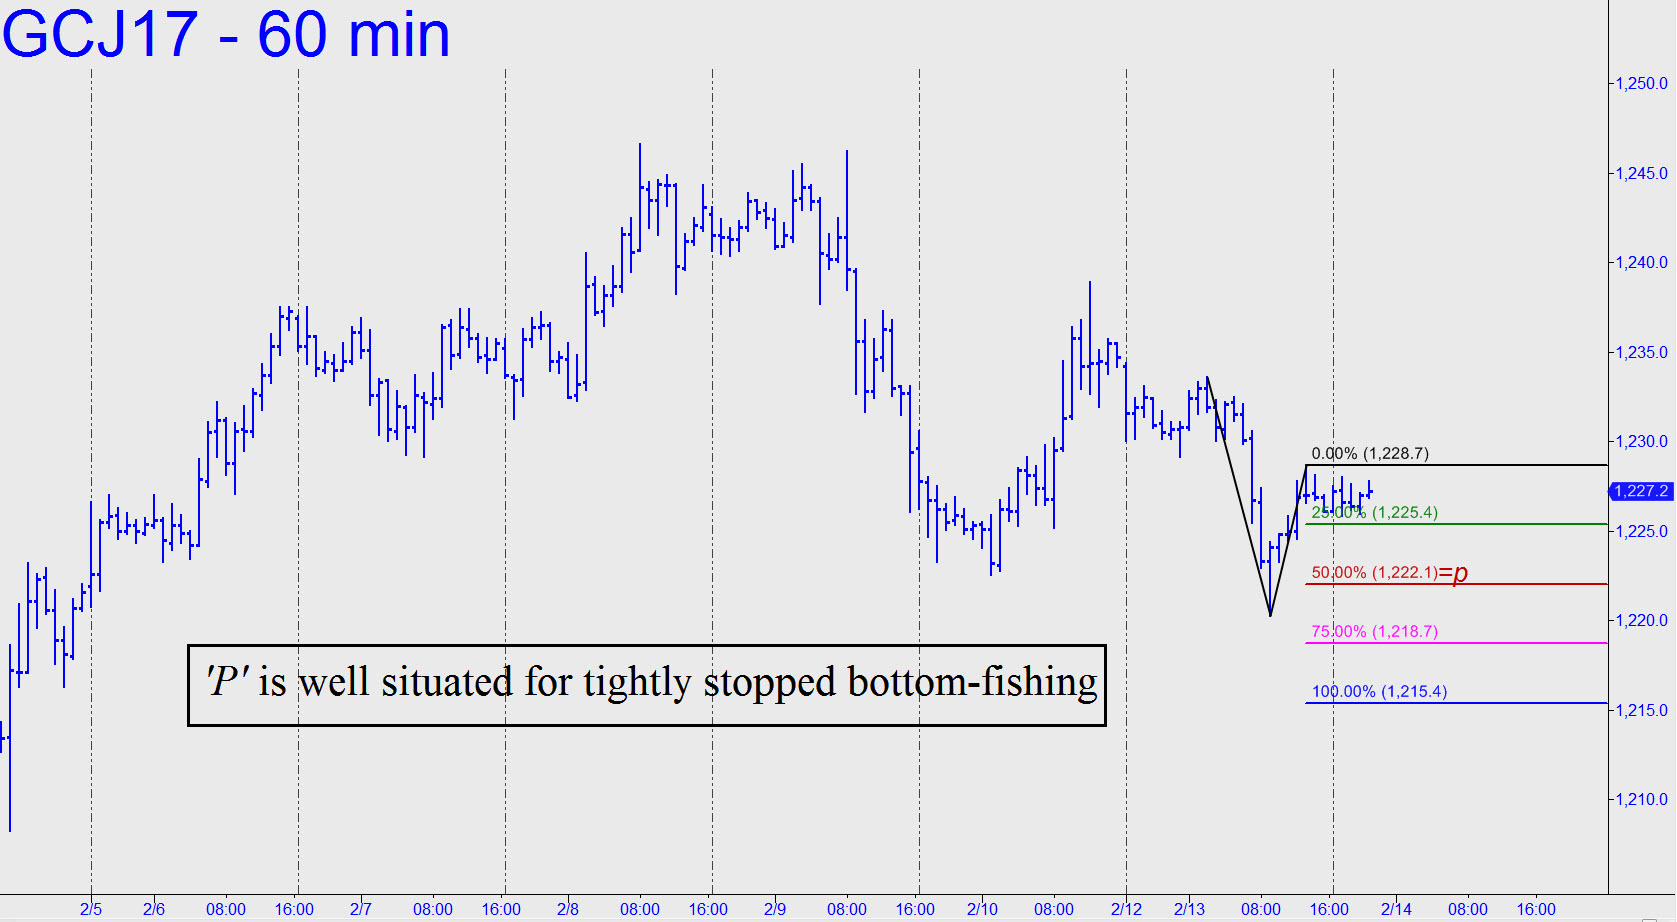
 The ABC pattern shown, with a 1255.90 rally target, still looks like the one that is controlling price action in this vehicle at the moment. So much the better, since the failure of sellers on Friday to bring the futures down to the red line, where we might have sought to get long ‘mechanically,’ hints of buying power beneath the surface. Looking just ahead, you can buy a swoon to the green line ‘mechanically’ on Monday, but I wouldn’t advise trying this at the red line. Why? At the moment, I’d prefer to do my buying in gold when bulls are getting terrorized rather than merely discomfited. Friday’s swoon from above the pink line was closer to the former, and it’s unfortunate that the intraday low occurred just shy of our optimal one. _______ UPDATE (Feb 13, 10:18 p.m. EST): I’ve changed the picture (see inset) to show a minor corrective pattern that can be bottom-fished with a bid at 1222.20 and a stop-loss as tight as 1221.80. There are no guarantees this midpoint Hidden Pivot support will contain sellers, but its location looks opportune to me for trading purposes. If the stop is hit, look for further slippage to at least d=1215.40. Please note that the mechanical buy described above, at 1200.90, stop 1182.50 remains valid. ________ UPDATE (Feb 14, 7:08 p.m.): Today’s mildly wacky price action, inspired by yellenblather, altered the pattern I’d suggested trading. I’ll hazard no further predictions for Wednesday. _______ UPDATE (Feb 15, 8:45 a.m.): This morning’s nasty, gratuitous takedown targets 1209.90 off this pattern on the 60-minute chart; a=1246.20; b= 1220.30. The futures will have a chance to turn up from p2=1216.40, however. If the reversal goes all the way to 1235.90 by tomorrow, that would be quite bullish.
