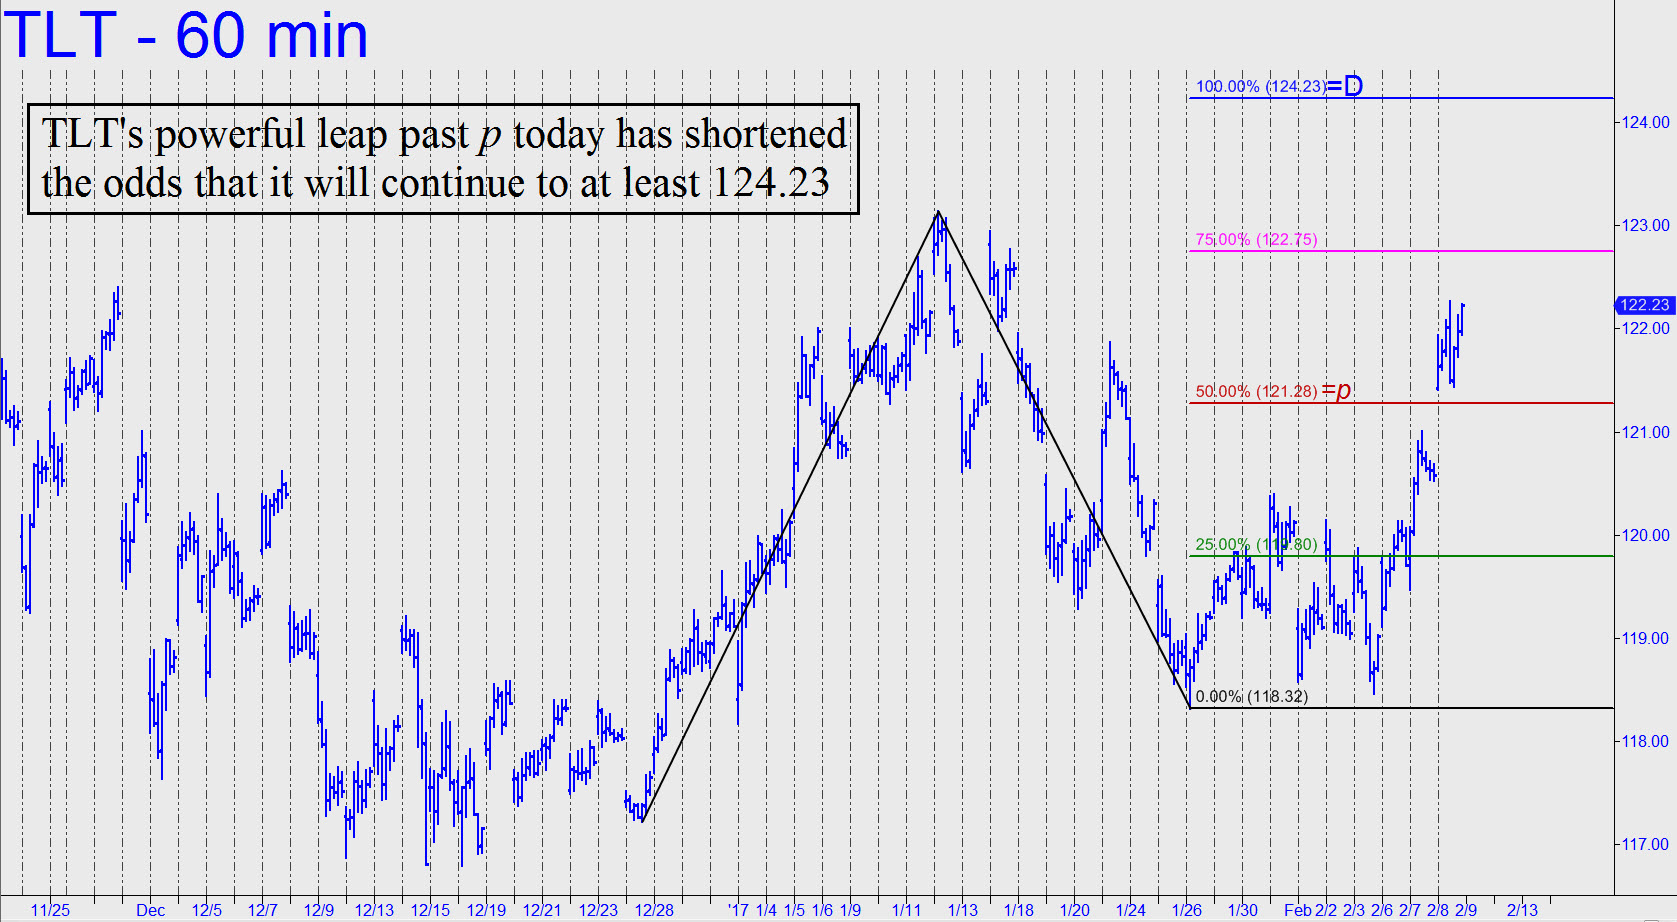
 TLT is within a day’s rally of an important resistance, a midpoint Hidden Pivot at 121.28 (see inset) that is associated with a target at 124.23. If that last number were to be achieved, it would correspond to a drop in T-Bond rates to 2.83% from a current 3.02%. It is what happens after that that’s important, however, since the target is compelling enough that we should expect a tradable pullback from it. If instead the futures push past 124.23 with little effort, especially after a stall that has lasted less than three days, it would strongly imply that the felicitous trend in long-term rates is likely to continue. _______ UPDATE (Feb 8, 8:24 p.m. EST): TLT took a powerful leap this morning — more or less on schedule — and looked to be getting second wind for another surge when the session ended (see inset, a new chart). The intraday high at 122.27 smoked the midpoint resistance at 121.28 I’d flagged above, lending authority to the rally and increasing the likelihood of a further push to 124.23 or even higher. The next 1.00 point or so of upside will encounter some serious resistance in the form of two peaks recorded in mid-November, plus the 122.75 ‘secondary pivot’ shown in the chart as a bright pink line. If bulls make short work of these obstacles, getting to 124.23 will become a lead-pipe cinch. _______ UPDATE (Feb 9, 7:37 p.m.): Bulls retreated on Thursday, but not before having pushed TLT above Jan 23’s 121.87 ‘external’ peak. That makes this weakness corrective in theory, so we’ll continue to give the uptrend the benefit of the doubt.
