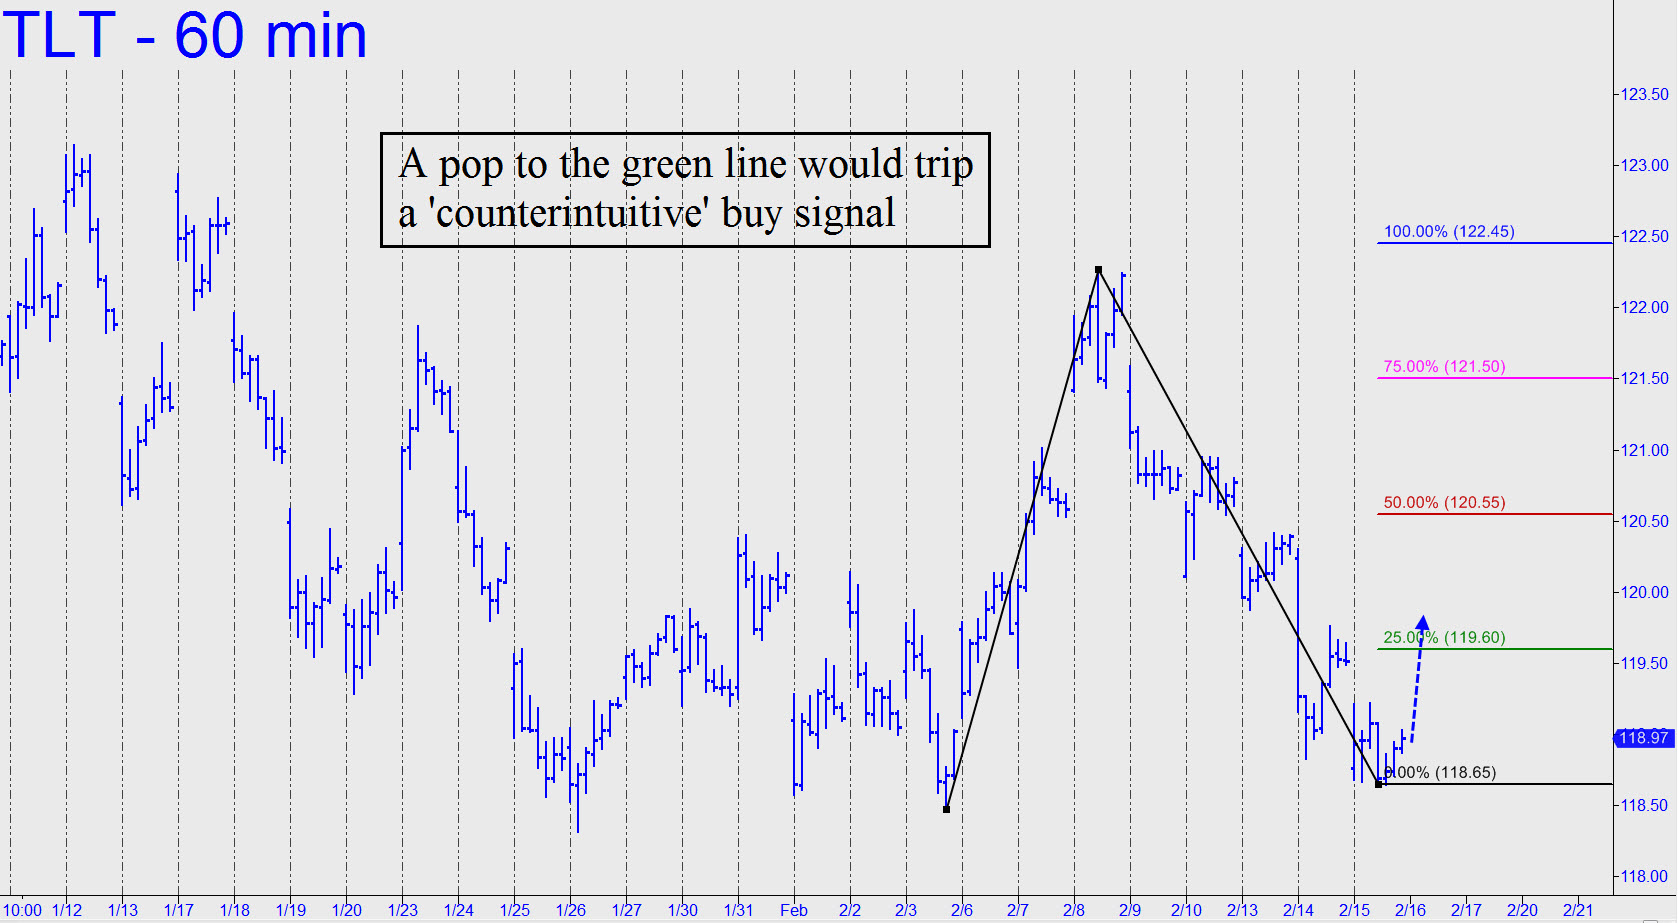
 Although TLT ended the week in retreat, the midweek high at 122.27 generated a bullish impulse leg on the hourly chart that implies the weakness since then has been merely corrective. For trading purposes let’s take the easy route here with a ‘mechanical’ bid at the green line (119.80), stop 118.31. I see more risk in this instance of having our bid go unfilled than in getting stopped out. Be that as it may, if TLT breaks higher at the bell, we’ll need to find another way in. (A low-risk possibility if TLT falls on the opening would be to use the 119.47 low labeled in the chart to fashion a ‘counterintuitive’ entry trigger.) With so compelling a rally target at 124.23, it behooves us to keep trying. _______ UPDATE (Feb 13, 10:15 p.m. EST): The current retracement could come down to as low as 118.47 without altering my bullish outlook for the next few weeks. But it will take a booster-stage rally of at least 95 cents from somewhere above 118.47 to get the next rally cycle going. Its potential would be to as high as 123.65.________ UPDATE (Feb 14, 7:03 p.m.) The bounce from an intraday low at 118.83 missed triggering the implied buy signal at 119.78 by two cents. Let’s see if buyers can hit the tripwire on Wednesday. _______ UPDATE (Feb 15, 8:16 p.m.): During this morning’s weekly tutorial session, we decided against buy-stopping our way aboard ‘counterintuitively’ at 119.60. However, a different mood could prevail on Thursday, and so you should consider the trade if an early-morning leap brings TLT close to the green line. If the trade triggers, be sure to nail down a partial profit at 120.55 if the opportunity arises. _______ UPDATE (Feb 16, 8:42 p.m.): The trade recommended above triggered and immediately went in-the-black, but because no one reported doing it, I have not established a tracking position.
