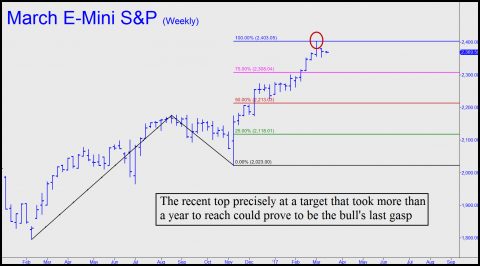
 [Editor’s note: I am going to keep this analysis at the top of the page for a few days because I want to be clear and loud about where I stand. RA] In January, with the E-Mini S&Ps trading at 2292.00, I sent out to subscribers a 2403.30 target that implied a rally equivalent to 1000 Dow points was imminent. A month later, after the futures had rallied 65 points and the Dow 500, I doubled down on the prediction, noting at the time that a further ascent to 2403.30 “was as certain as an ostensibly unpredictable event could be.” Time proved me right when, two weeks ago, the March E-Mini contract came within two points of the target. This is shown in the chart above. The futures have since retraced slightly, but given the importance of the target, which took more than a year to reach, we should be open to the possibility that the bull market begun exactly eight years ago has finally topped. I’ll let the chart, with target levels derived from the Hidden Pivot Method, speak for itself as to the clarity and importance of the recent, record high.
Stock Market Bulls Had Better Take This Chart Seriously
- March 13, 2017, 9:08 pm
-
March 13, 2017, 1:24 pm
HDGE does not seem to want to drop. I was expecting to see a buy point at 5.5, the P and F target. No such luck. What is the buy price?

Since Trump took office the United States Treasury general account balance has gone from $390 billion to just $66 billion. One could assume that money has found its way into the stock markets. This could also prove the theory that we’ve got some tops in place here.