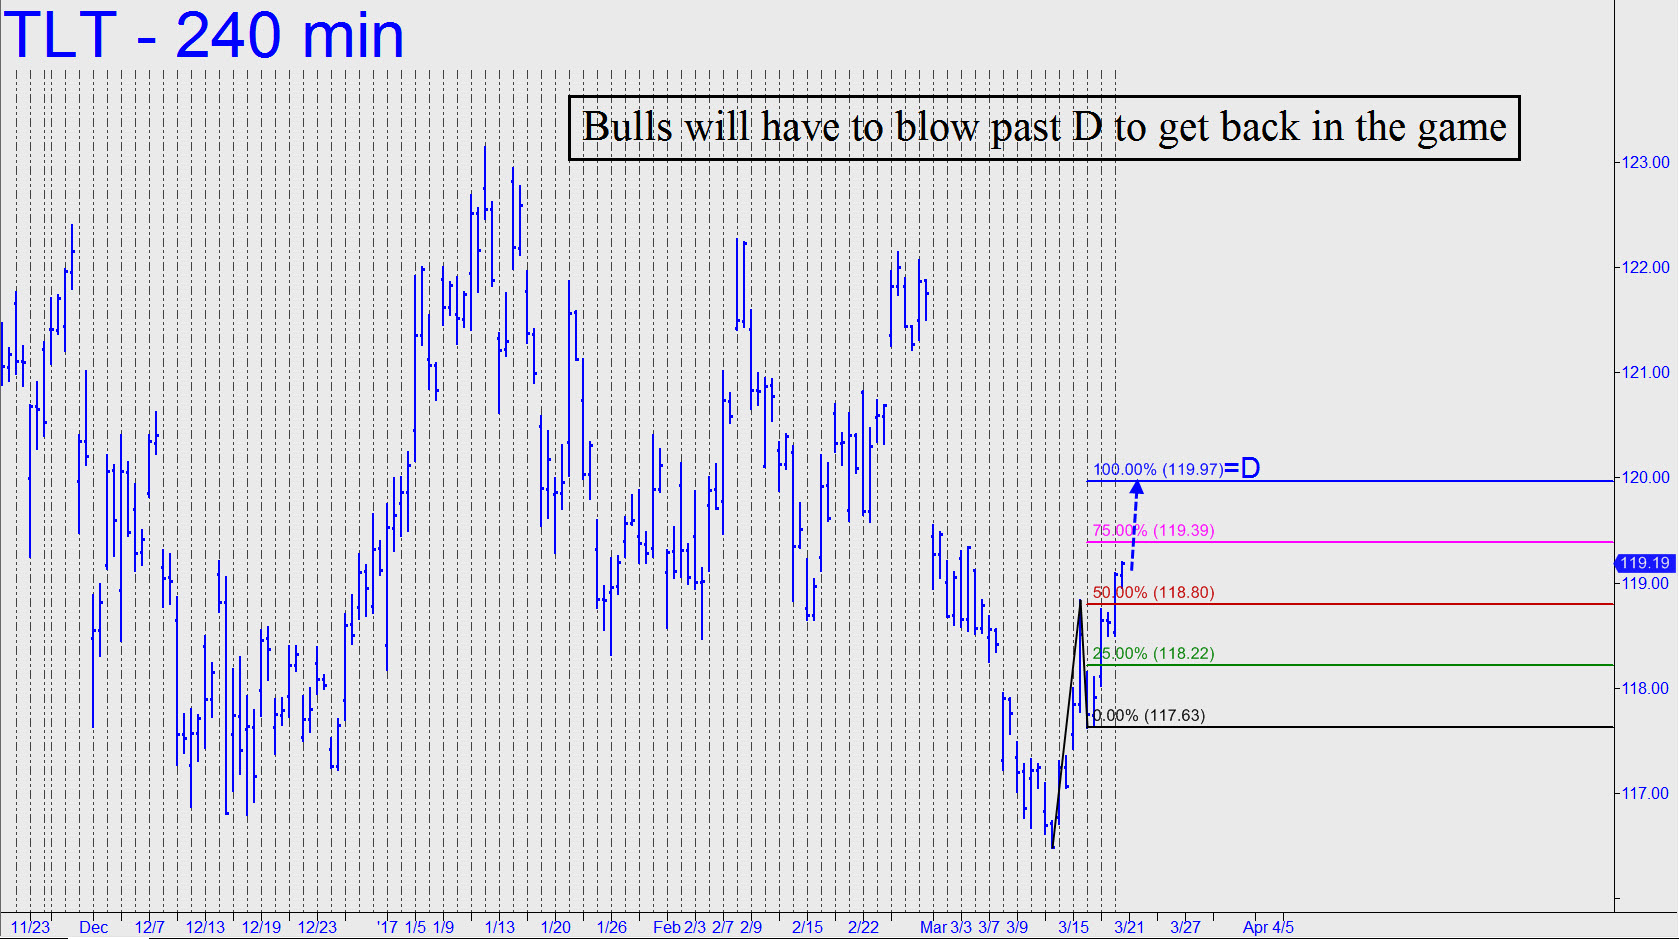
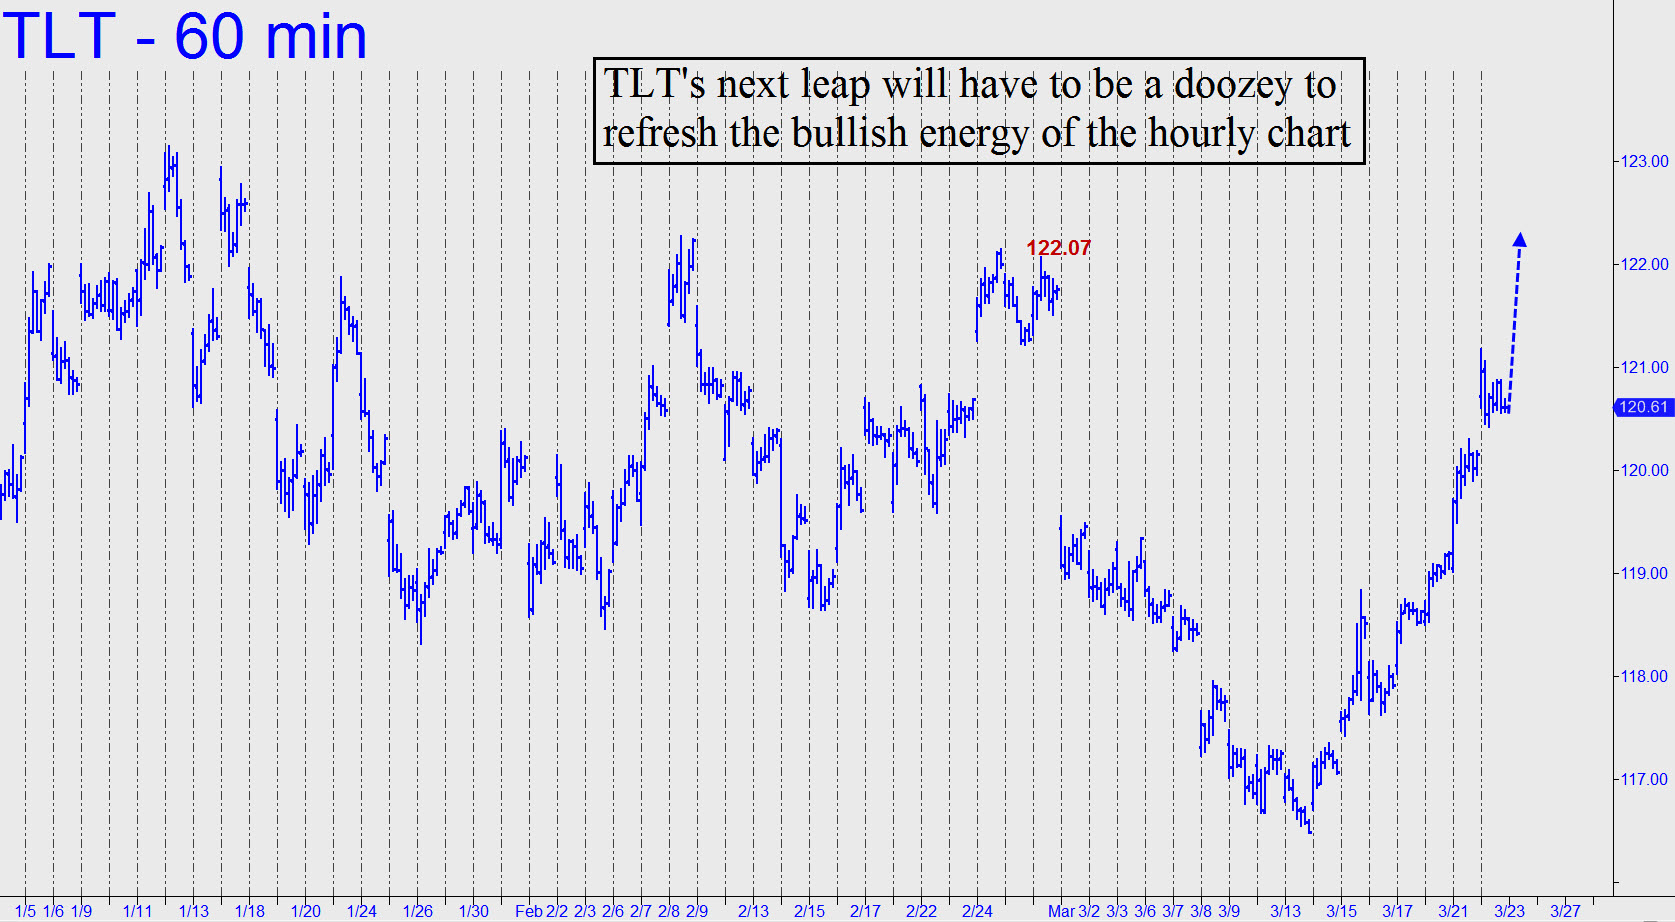
This proxy for T-Bonds has quietly slipped into no man’s land with the recent breach of December’s bombed-out lows near 116.80. Even before this occurred, TLT looked like a good bet to fall to at least 111.97, the midpoint Hidden Pivot support of the pattern shown. But it would require only a breach of the July 2015 low at 114.88 to do very serious damage to the long-term chart. If the 111.97 target is hit, it would correspond to a rise in long-term interest rates to about 3.37% from a current 3.19%. And if TLT were to fall all the way to the D target at 100.79, yields would be around 3.84%. For borrowers in the U.S. and around the world, this would be more than just a turn of the screw. Indeed, if stock prices were to fall simultaneously as seems logical, it would crush them beyond any hope of recovery. Meanwhile, any counter-stimulus equal to the problem would be tantamount to hyperinflation. _______ UPDATE (Mar 20, 8:41 p.m. EDT): Is this rally fated to go nowhere like every rally since July? We’ll know if and when it interacts with so clear and compelling a target as the one shown, at 119.97 (click here for chart). Merely reaching this benchmark will tell us little; however, if buyers can demolish it, that would give TLT a fighting chance to probe the resistance of peaks made in January and February as high as 123.14. _______ UPDATE (Mar 22, 9:55 p.m.): TLT impaled the 119.97 ‘hidden’ resistance noted above, implying that the pullback currently under way is likely to generate another bull leg. It will need to be a doozey, however, since it must surpass Feb 28’s 122.07 peak to generate a fresh impulse leg on the hourly chart. (Click here to see this graphically). _______ UPDATE (Mar 27, 10:58 p.m.): TLT came within an inch today of surpassing the 122.07 peak before receding sharply. The bull trap this created on the opening bar is going to generate considerable downforce over the next 1-3 days, but we’ll give bulls the benefit of the doubt for the moment as they attempt the feat again with a running start.