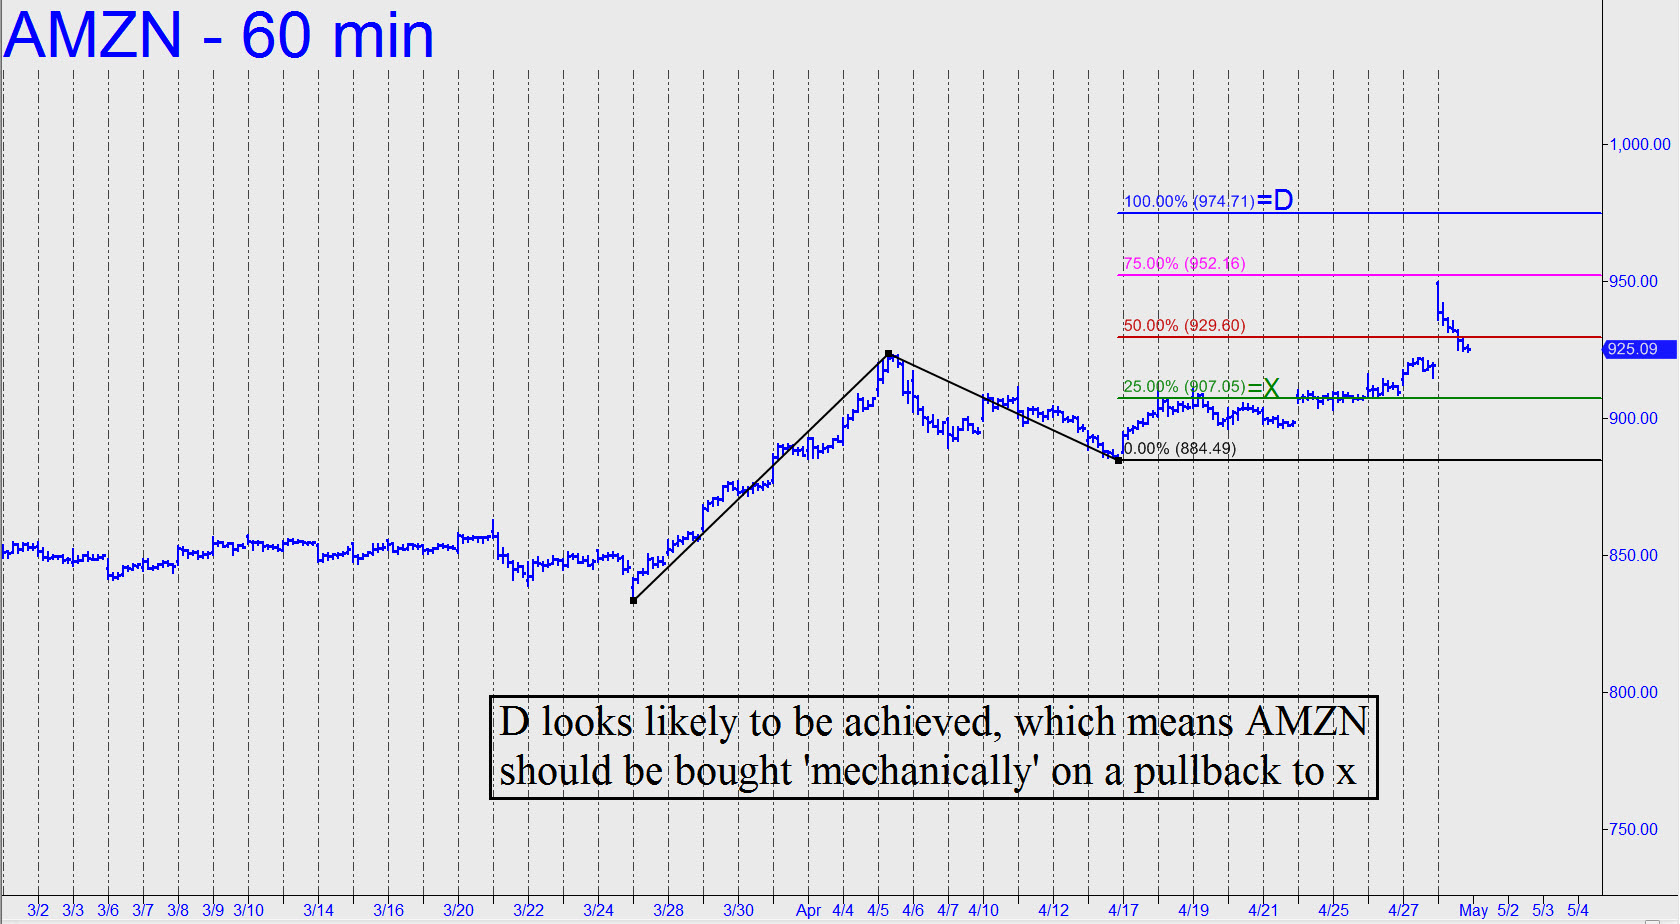
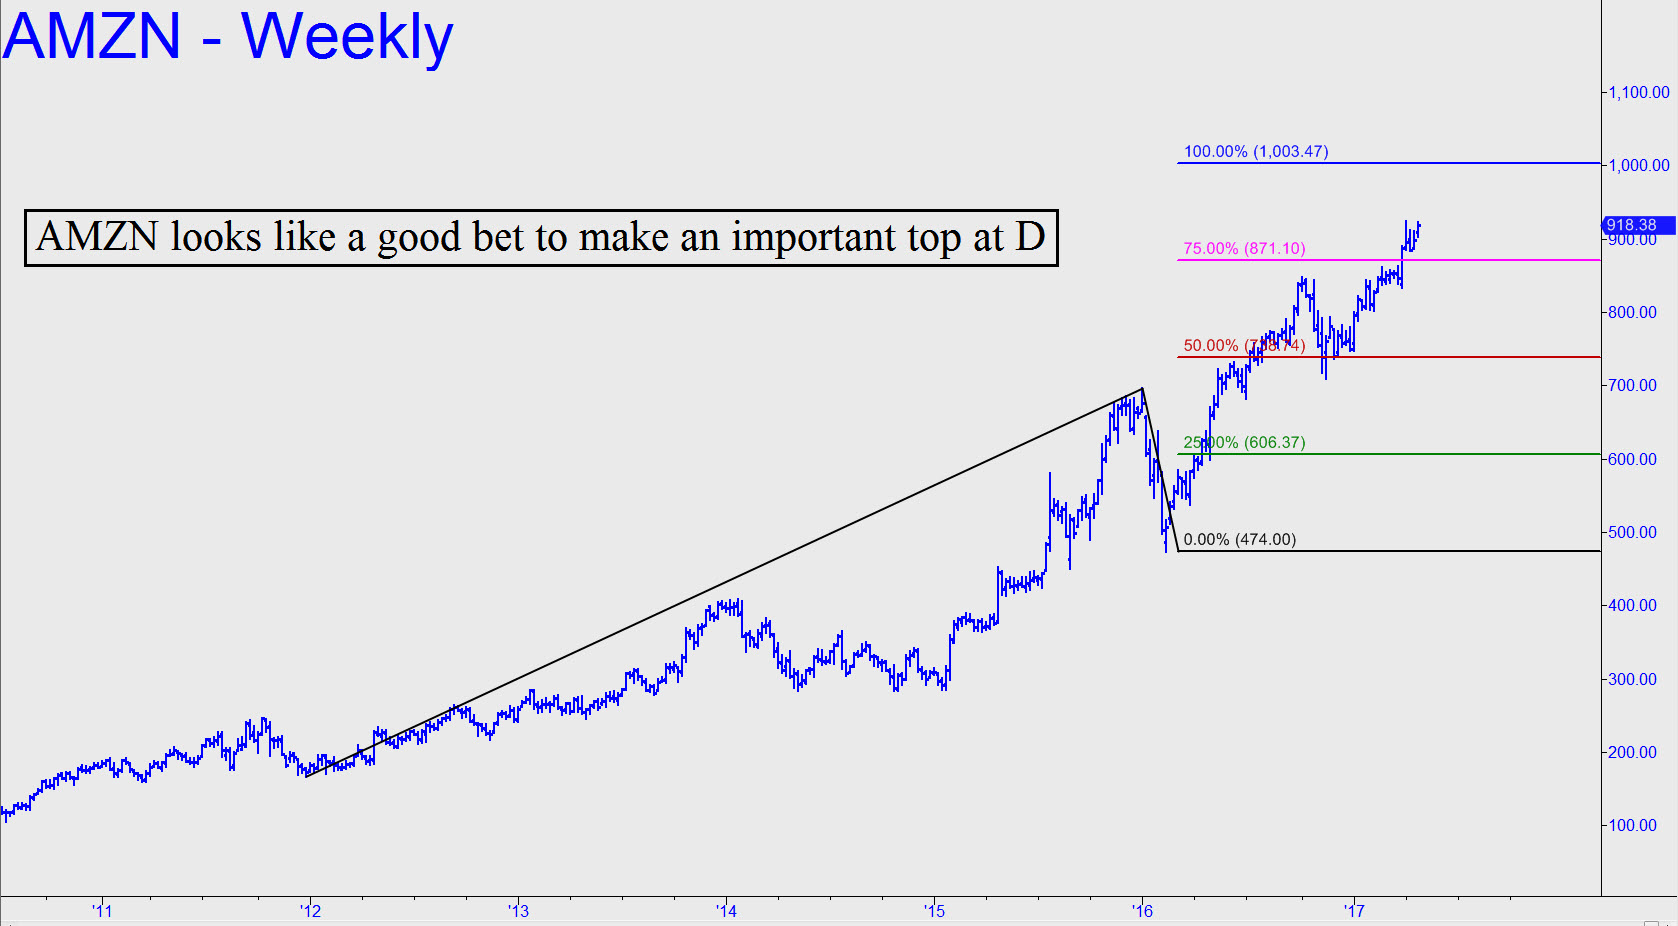
 AMZN soared skyward after the close on strong sales for Q1. I’ve been remiss in tracking the stock recently, especially considering that it is our number one bellwether for the stock market. That implies that as long as Amazon shares are moving even moderately higher, the broad averages can do worse than go sideways. It also means that if one gets this stock right, one cannot go far wrong with one’s market forecast. So what might we expect from AMZN in the weeks ahead? For the moment, I’ll suggest using 929.60 as a minimum upside projection. That’s about $10 above where the stock is currently trading in after-hours. It is the midpoint Hidden Pivot resistance of an ABC rally pattern that projects to 974.71, a high-odds target that I mentioned in the chat room (coordinates on the 60-minute chart: A= 833.50 on 3/27; B=923.72). However, the chart I’ve produced today (see inset) shows a pattern of significantly larger degree that projects to 1003.47. We’ll plan on trading with a bullish bias until AMZN gets there, but we will also look to short the pivot aggressively with a tight stop-loss because its provenance is so clear and compelling as to a possible bull-market top. _______ UPDATE (Apr 30, 6:30 p.m.): Friday’s short-squeeze-powered lunatic lunge died just shy of the 952.16 ‘secondary’ Hidden Pivot associated with our target (click here for chart) at 974.71. It looks very likely to be achieved, implying that a pullback to the green line at 907.05 should be used to get long via a ‘mechanical’ bid there, stop 883.99. Because that would entail nearly $1700 of initial risk per round lot, we’ll plan on converting the ‘mechanical’ signal to ‘camouflage’ if the opportunity arises. For that to occur, AMZN would need to come down to within perhaps 0.20-0.30 of the green line. Stay tuned to the chat room if you care. _______ UPDATE (May 4, 6:13 p.m.): Given the steep pitch of AMZN’s uptrend off the March 27 low at 833.50, I am now recommending a ‘mechanical’ bid at p=929.60 rather than at 907.05. The implied stop-loss at 914.56 would subject us to more entry risk than we should be willing to abide, so I’ll instead suggesting generating a ‘camouflage’ entry trigger on the 15-minute chart (or less) if and when 929.60 is touched on the pullback.