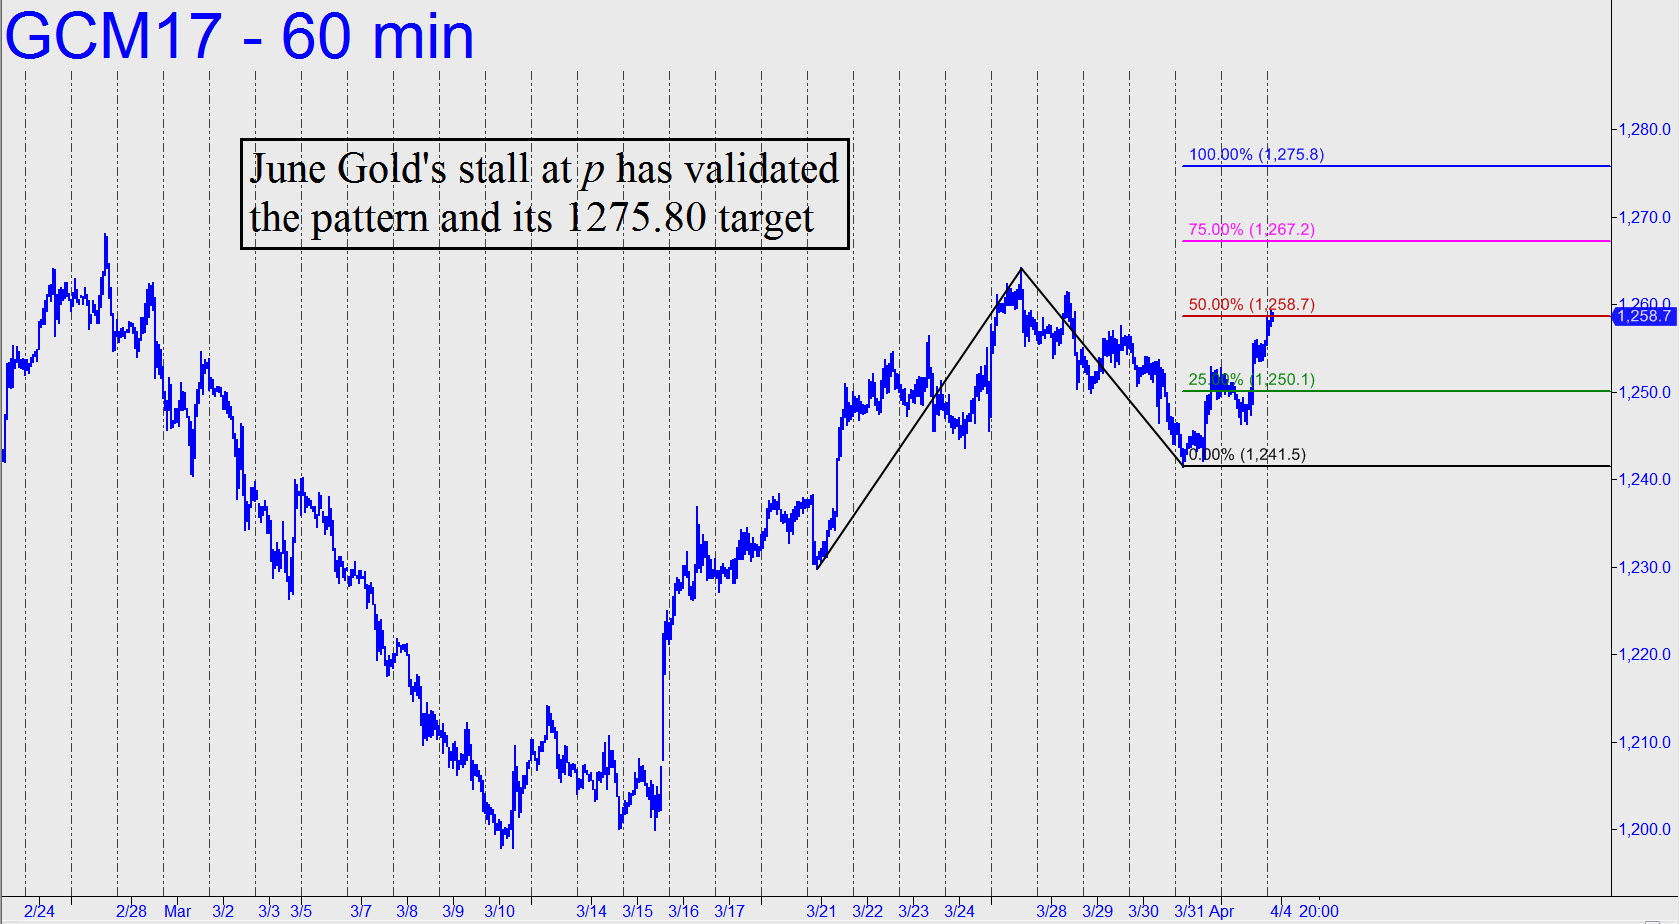
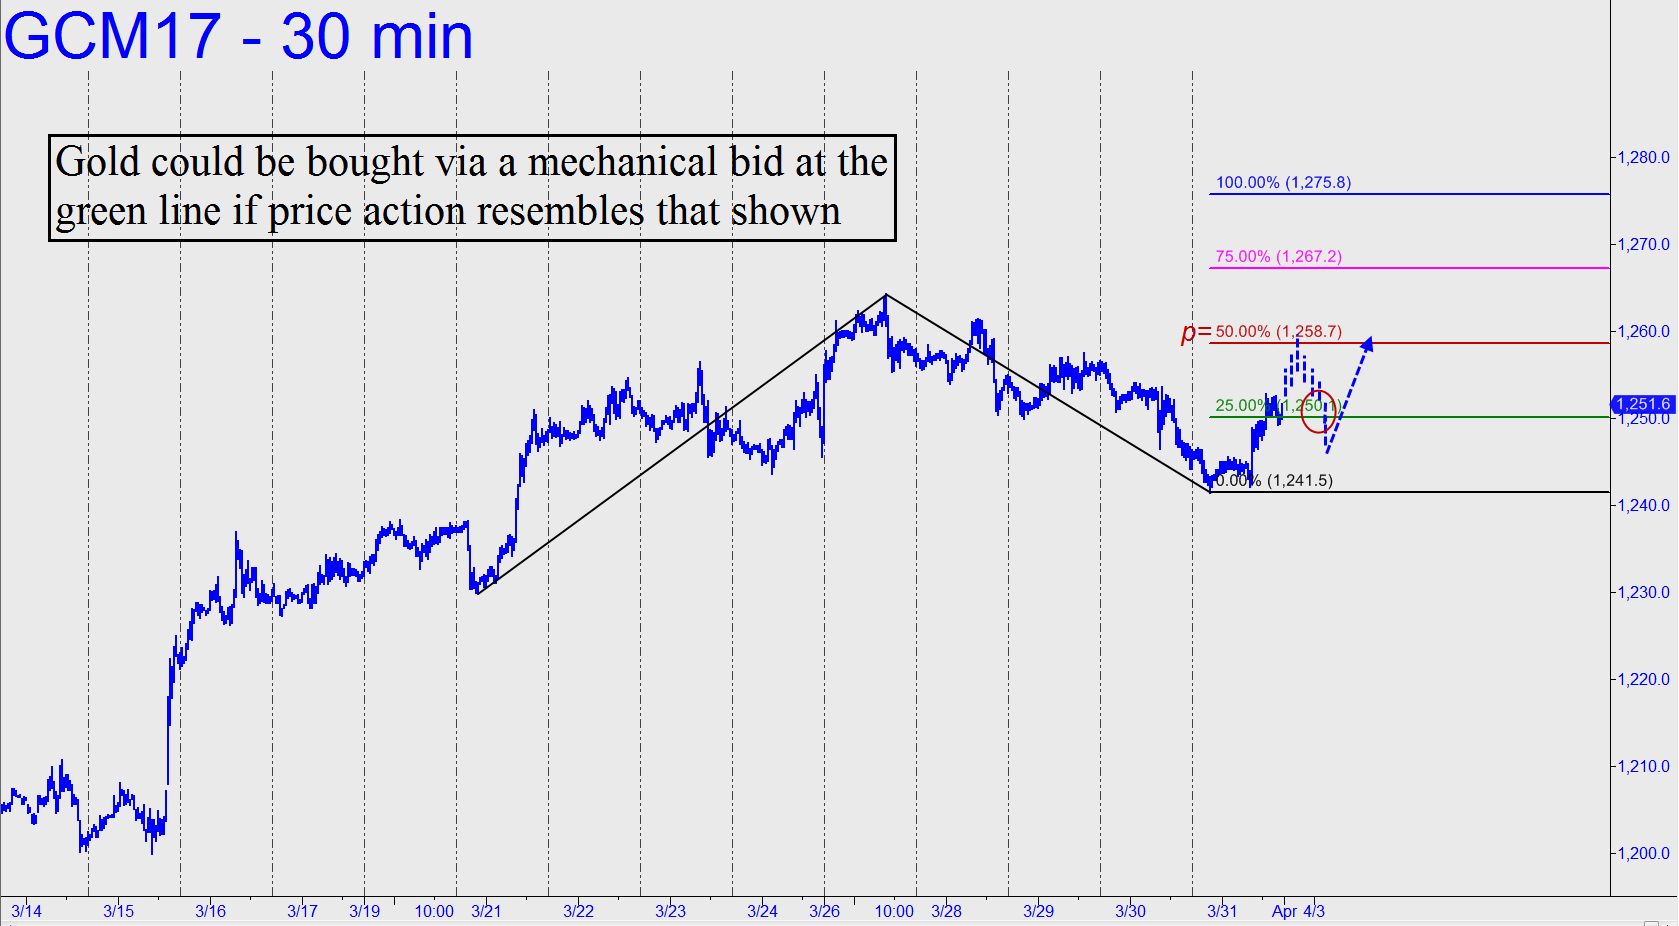
 Gold earned the begrudging benefit of the doubt Friday, even though the intraday low exceeded a Hidden Pivot correction target, and although it also generated a bearish impulse leg on the hourly chart. When the dust settled, the futures had tripped a theoretical buy signal at the green line (1251.60), implying more upside to at least 1258.70, the midpoint pivot of the pattern. The move projects to as high as 1275.80 over the near term, but that target won’t be in play until such time as buyers decisively exceed the midpoint resistance with evident ease. Under the circumstances, I can recommend a ‘mechanical’ bid at the green line, but only if it is touched on Monday after the futures have hit or exceeded p=1258.70. This is shown hypothetically in the chart. ______ UPDATE (Apr 3, 9:16 p.m.): The June contract has been the obedient slave of the bullish pattern noted above, with a 1275.80 rally target. The intraday high on Monday occurred almost precisely at the 1258.70 midpoint pivot (see above) as we might have expected, but buyers will need to exceed this benchmark by at least 2.20 intraday, or close above it for two consecutive days, before 1275.80 would become an odds-on bet to be reached. A ‘mechanical’ bid at the green line, stop 1241.40 is warranted on Tuesday if the pullback to it meets our criteria, but I’m not yet ready to green-light a ‘mechanical’ entry at p=1258.70. (Click here for a fresh chart.) _______ UPDATE (Apr 4, 10:37 p.m.): A bull-trap opening set a selloff in motion that looks bound for at least 1252.30 (30-min, a= 1263.70 at 8:30 a.m.). If the target is easily exceeded it would generate a bearish signal for the near term. _______ UPDATE (Apr 5, 11:23 p.m.): Gold reversed a selloff on Fed news that pushed stocks lower toward the end of the day, but I don’t trust the rally. Trust aside, the 1275.80 target is still viable in theory. Incidentally, the futures were a very juicy ‘mechanical’ buy on the initial fall Wednesday to x=1250.40.