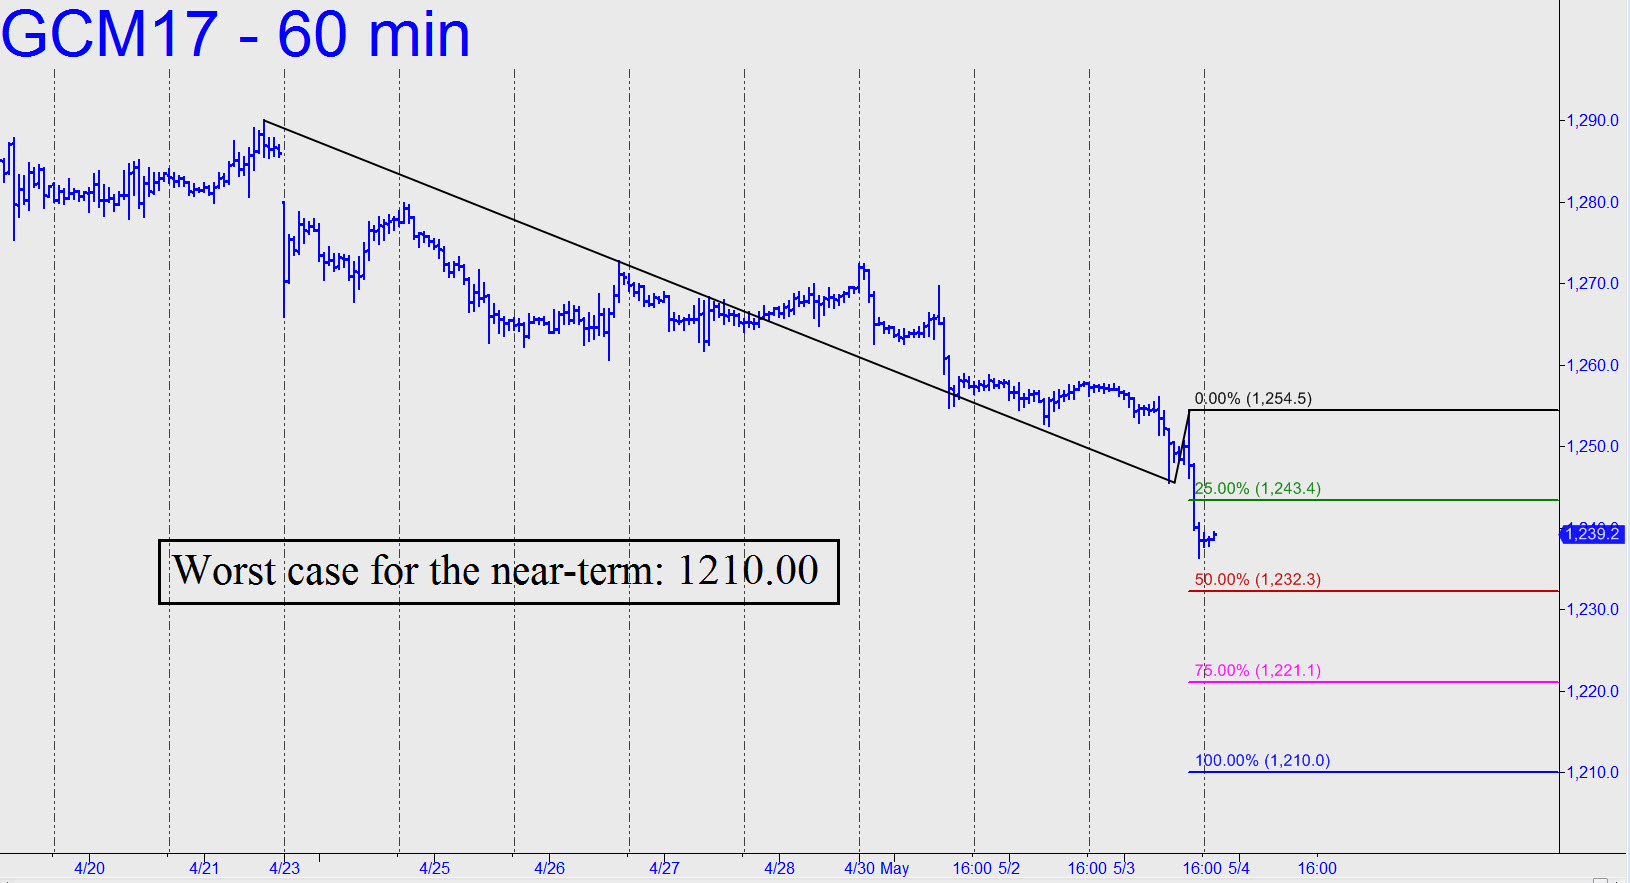
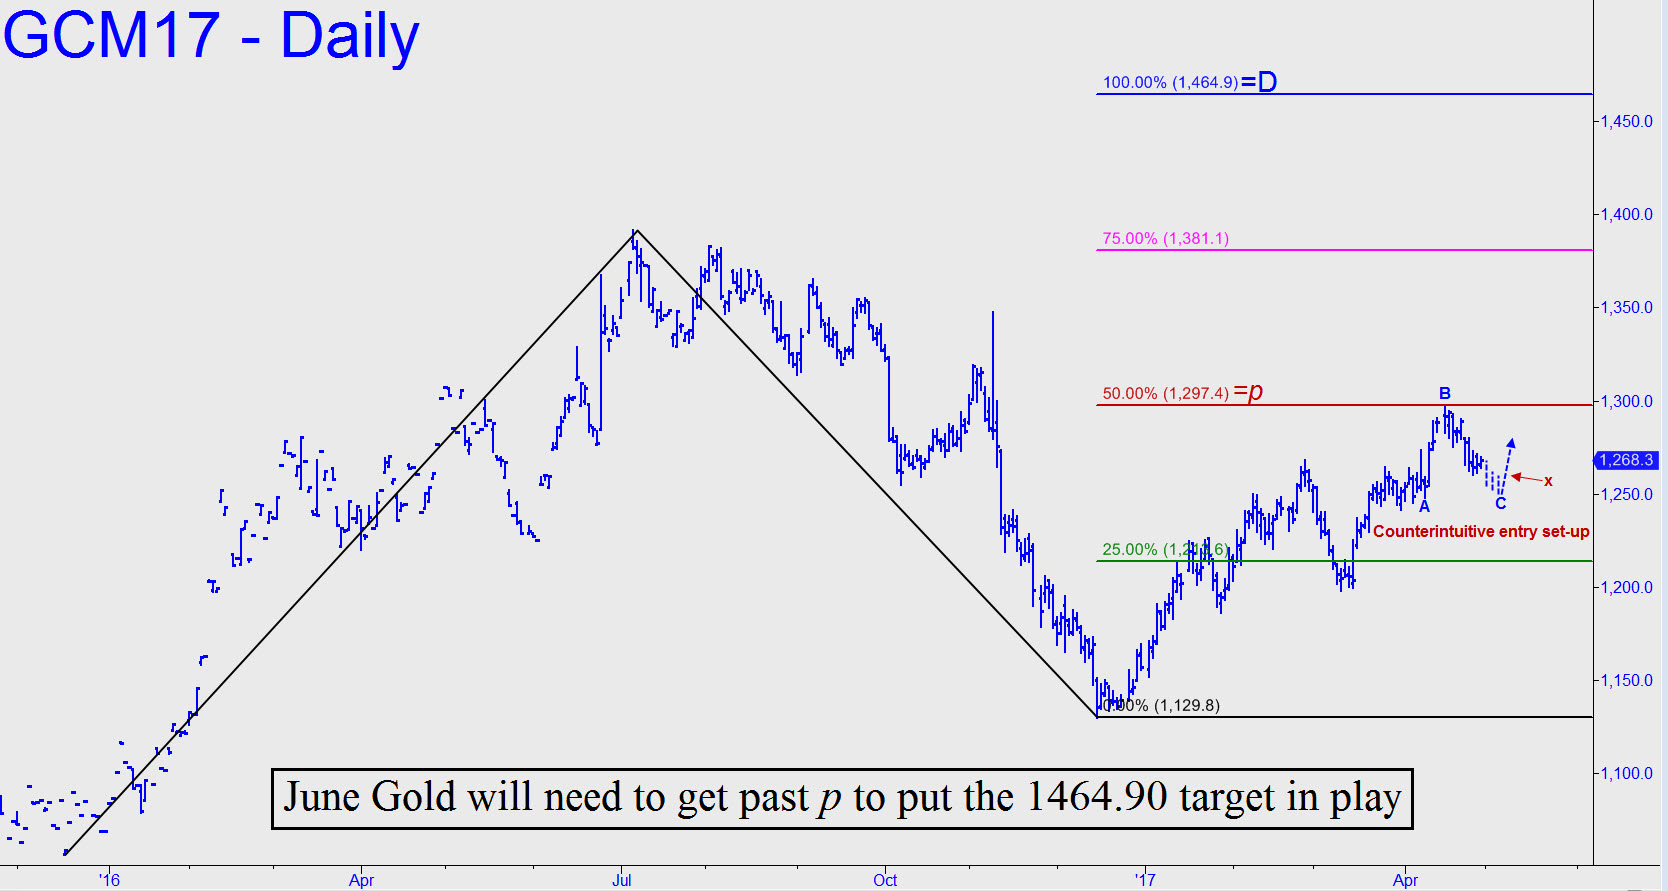
 Because the June contract has yet to exceed the 1297.40 midpoint Hidden Pivot resistance shown in the chart, it would be speculative to conclude that it is likely to achieve the pattern’s quite bullish 1464.90 target. However, one needn’t be a chartist to discern that the target is derived from a long-term bullish pattern that is both clear and persuasive. But if presumably corrective weakness were to return for the next several weeks, we might expect to see the futures grope their way down to 1188.60 (60-minute, a=1347.40 on 11/9/16), a fall of about 6% from current levels, before finding good support. In any event, I can recommend bottom-fishing with a ‘counterintuitive’ entry that would use a set-up similar to the one sketched hypothetically at the right-hand edge of the chart. Stay tuned to the chat room for guidance in real time if the futures take a path similar to this one. _______ UPDATE (May 1, 8:33 p.m. ET): No change. The futures would need to bottom in the range 1248.50-1250.00 to set up the trade noted above and described in the chart (inset). _______ UPDATE (May 3, 8:26 p.m.): Gold’s already steep slide accelerated today and looks bound for at least 1232.30, or perhaps 1223.70 if any lower. Worst case over the near term would be 1210.10, a target derived from this pattern. Beware of a bounce from p=1232.30, since that would validate the pattern and its target.