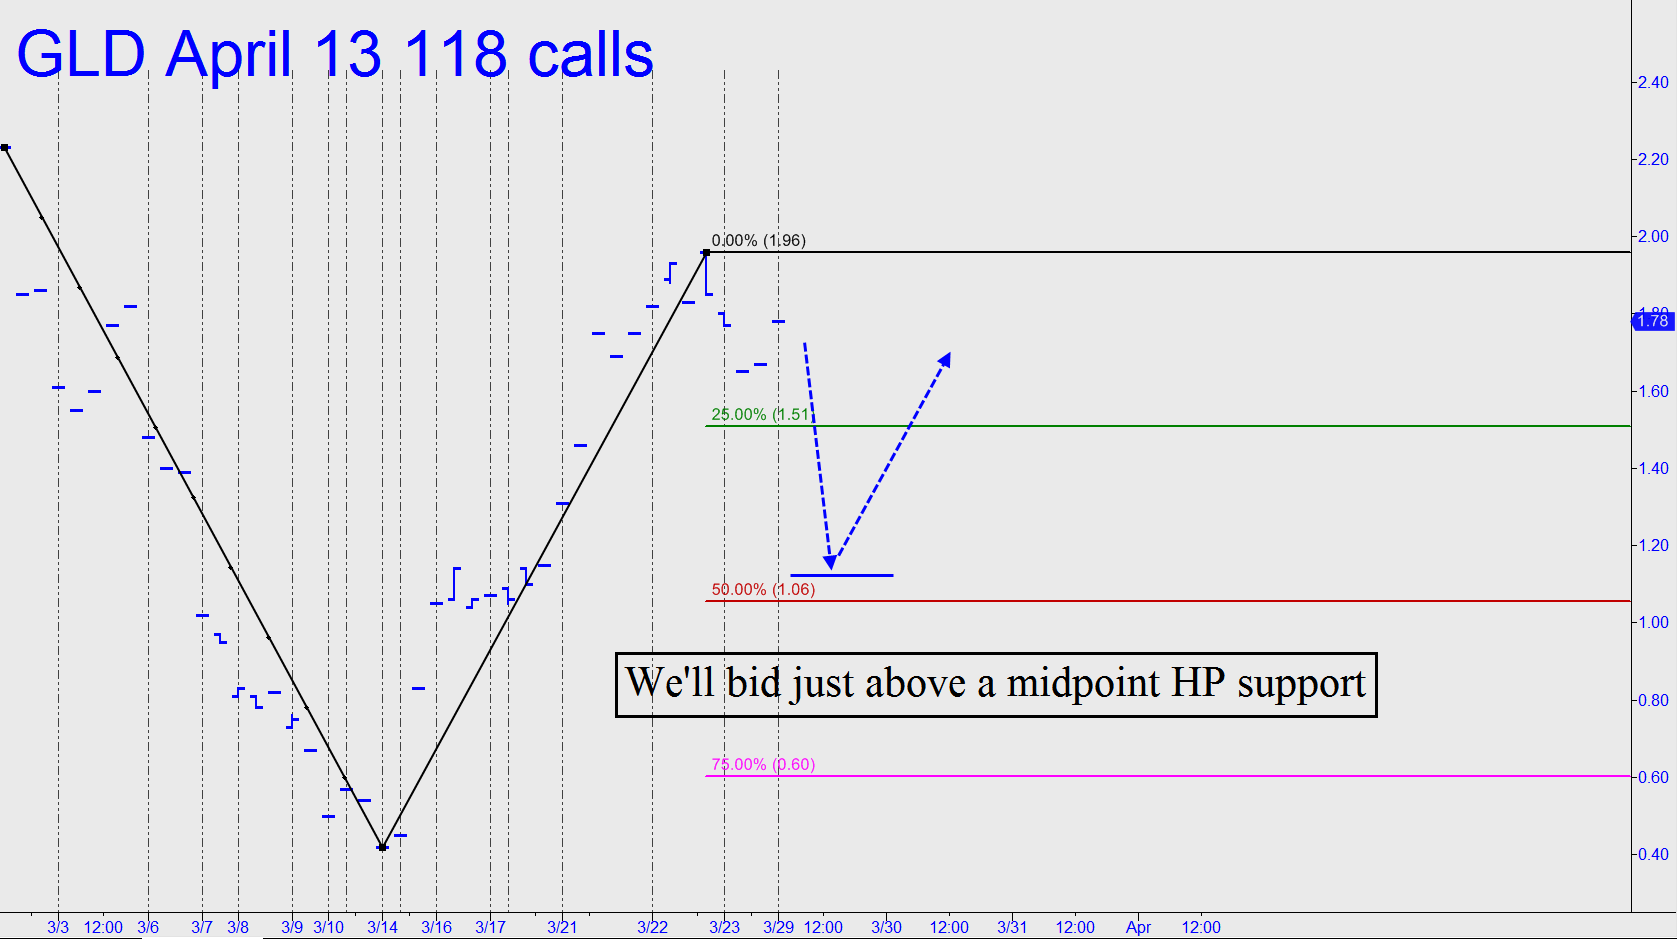
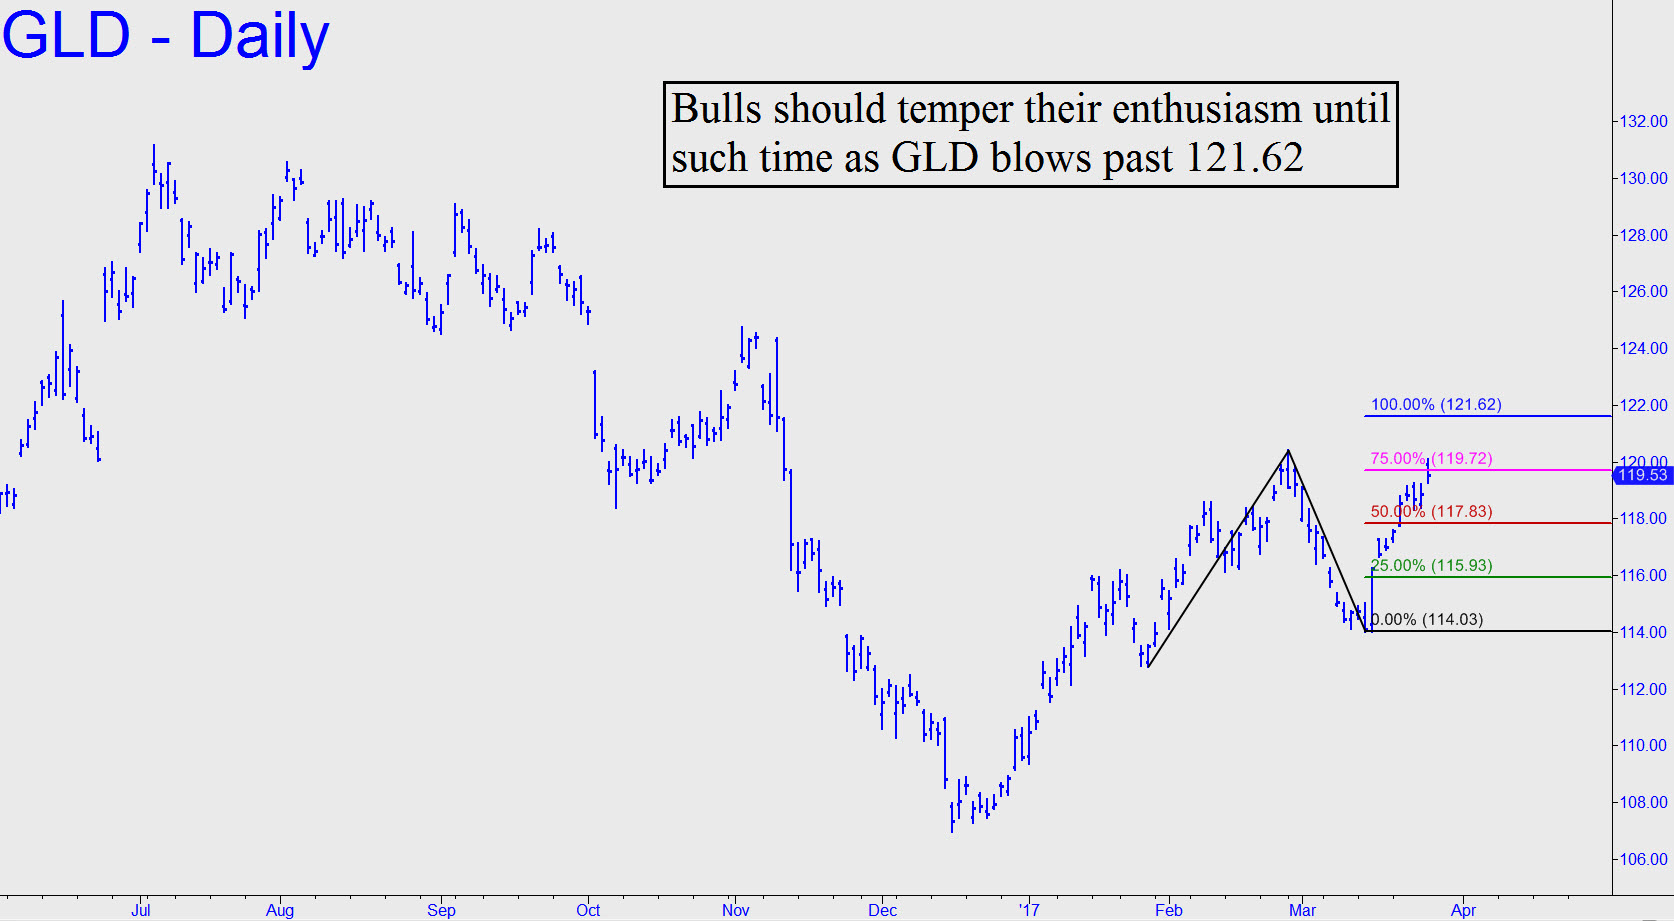
 GLD’s daily chart looks better than that of gold futures, but not much. The A-B impulse leg (see inset) is not especially promising because it failed to exceed any ‘external’ peaks. Still, it looks good enough for us to give bulls the benefit of the doubt, at least for the next 4-7 days, in assessing the odds for a push to the 121.62 target. That would still leave this trading vehicle more than a tad shy of last November’s 124.76 peak, which should serve as our benchmark for judging the power of the rally cycle begun in December from 107. Only a decisive push past that number on first contact would give us reason to be very bullish. In the meantime, I’d view a pullback to as low as 115.93 (i.e., the green line) as a ‘mechanical’ buying opportunity, although doing so at the 117.83 midpoint pivot seems too risky (although we cut cut it down to size by using a ‘camouflage’ entry trigger. For the moment, however, I have no swing or position trades to recommend, other than what we might find intraday on the sub-hourly charts. _______ UPDATE (Mar 30, 7:15 p.m.): Gold futures look like hell, but we’ll take a shot with this vehicle anyway just to have something to do on a Friday. I’ll recommend bidding 1.08 for four April 13 118 calls, but stop yourself out if GLD falls to 116.55. The rationale for the trade is that GLD itself would become a ‘mechanical’ buy on a pullback to the red line shown in the original chart (see inset). We’re bidding for the call just above the midpoint pivot, the most logical spot for a price reversal if it — and GLD — are about to turn around. Click here for a chart of the call option. _______ UPDATE (Apr 2, 6:15 p.m.): The calls traded no lower than 1.35, so there was nothing done on the order. Cancel it for now.