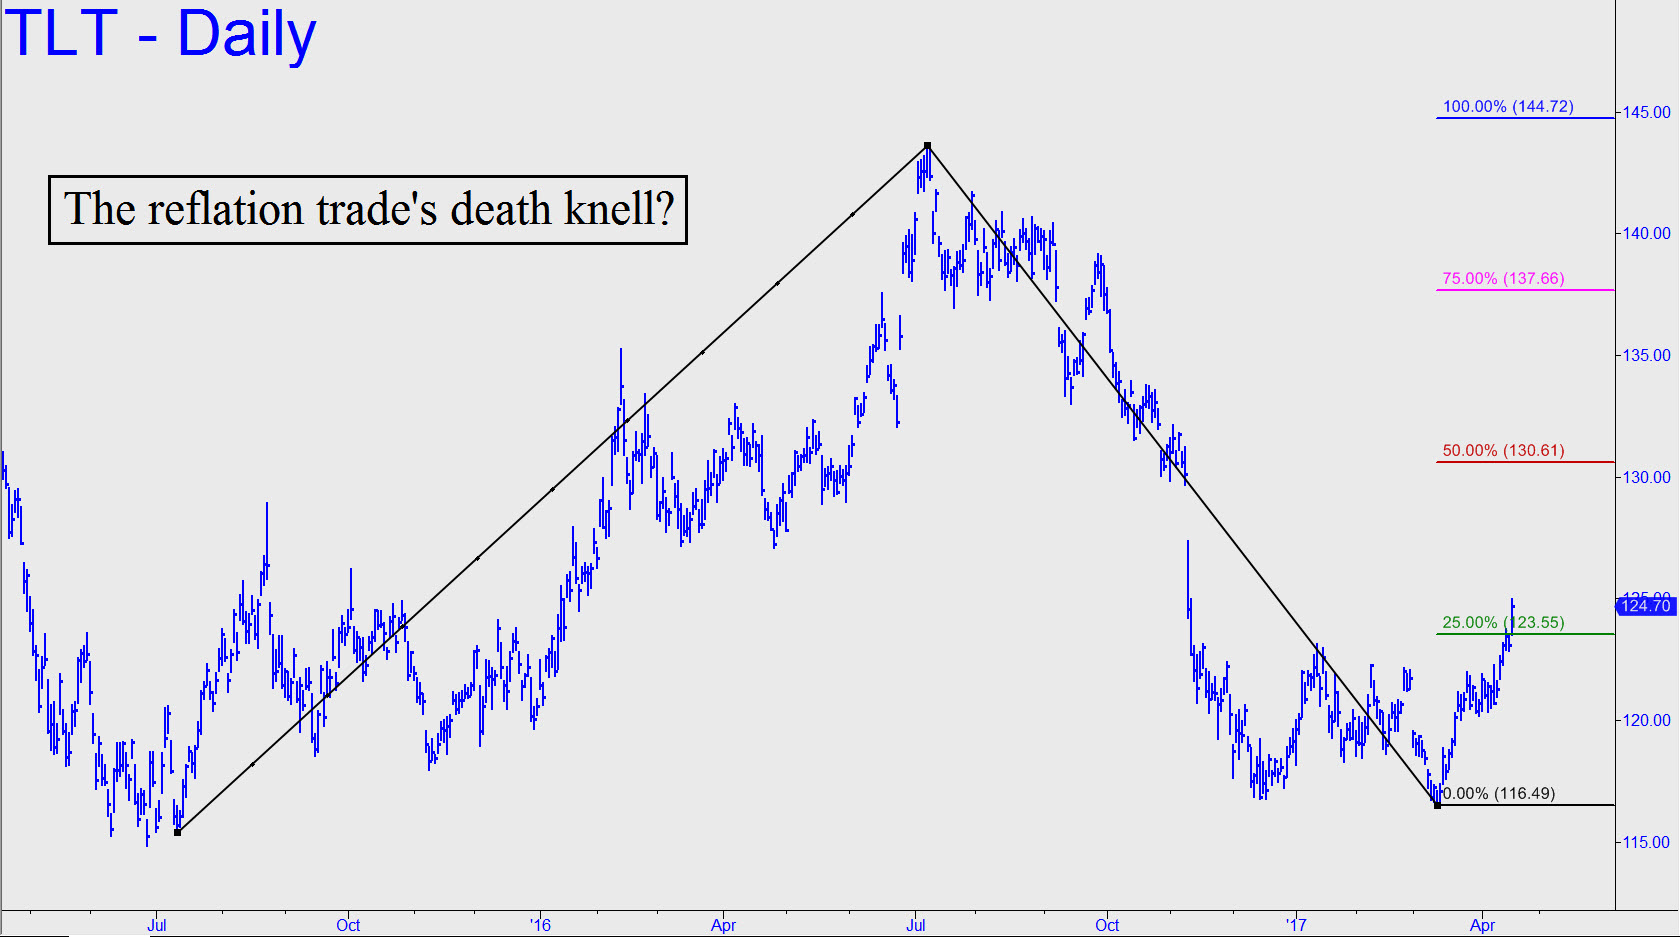
 Today’s ballistic move left our stingy bid choking on dust. It also tripped a theoretical ‘buy’ signal for the very major bullish pattern shown. With the steep rally of the last two weeks, a midpoint Hidden Pivot resistance at 130.61 has become an even-odds bet as a minimum upside projection. We’ll be following the move closely, looking for low-risk entry opportunities, since there’s a lot of room to the upside before this vehicle hits anything solid. For now, however, we won’t chase it, since a pullback when it comes is likely to be punitive. I’ve flagged the rally in today’s ‘Morning Line’ as signaling a possible end to the reflation trade. _______ UPDATE (Apr 25, 12:12 pa.m. ET): Look for the correction to continue to at least 122.27, or to 121.38 if any lower (60-min, a=124.24 om 4/21). UPDATE (Apr 25, 7:44 p.m.): Today’s selloff bottomed precisely at the 121.38 target I’d flagged above, allowing at least one creative subscriber to get long at the intraday low for a so-far modest profit. Now let’s see if TLT can get legs spring-boarding off this minor Hidden Pivot support. _______ UPDATE (Apr 26, 8:13 p.m.): TLT has now rallied 76 cents from the targeted low. Any subscriber who got aboard for the ride by bottom-fishing near 121.38 should let me know in the chat room so that I can establish a tracking position if one is warranted._______ UPDATE (Apr 27, 1:45 p.m.): Three subscribers have reported TLT positions acquired using the 121.38 correction target provided above. This Hidden Pivot support caught the recent low to the exact penny. As is customary when subscribers hold actual positions based on an actionable tout, I’m establishing a tracking position: 400 shares with a cost basis of 1.30. For now, I’ll recommend exiting half of the position at a current price of around 122.15. That will leave 200 shares (or multiple thereof) with a profit-adjusted cost basis of 120.66.
