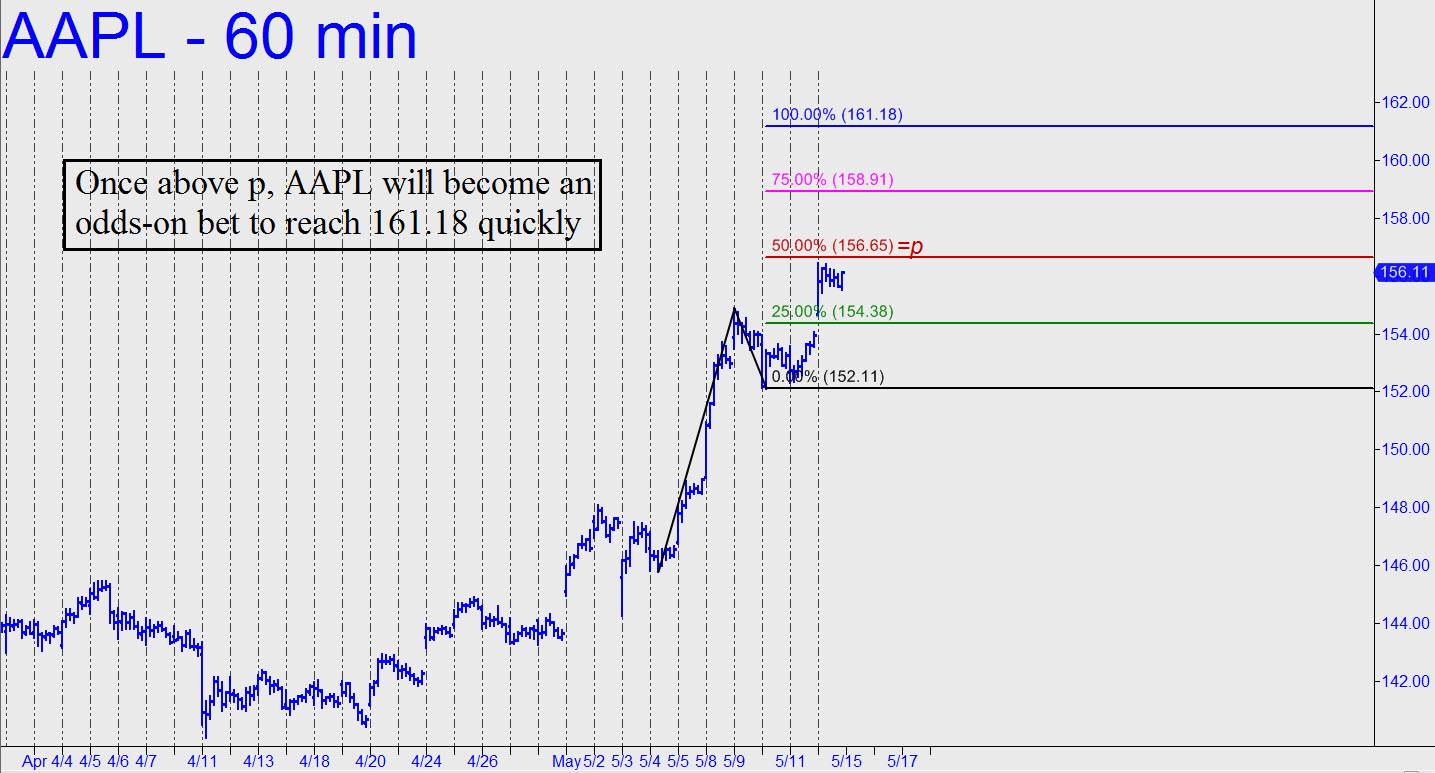
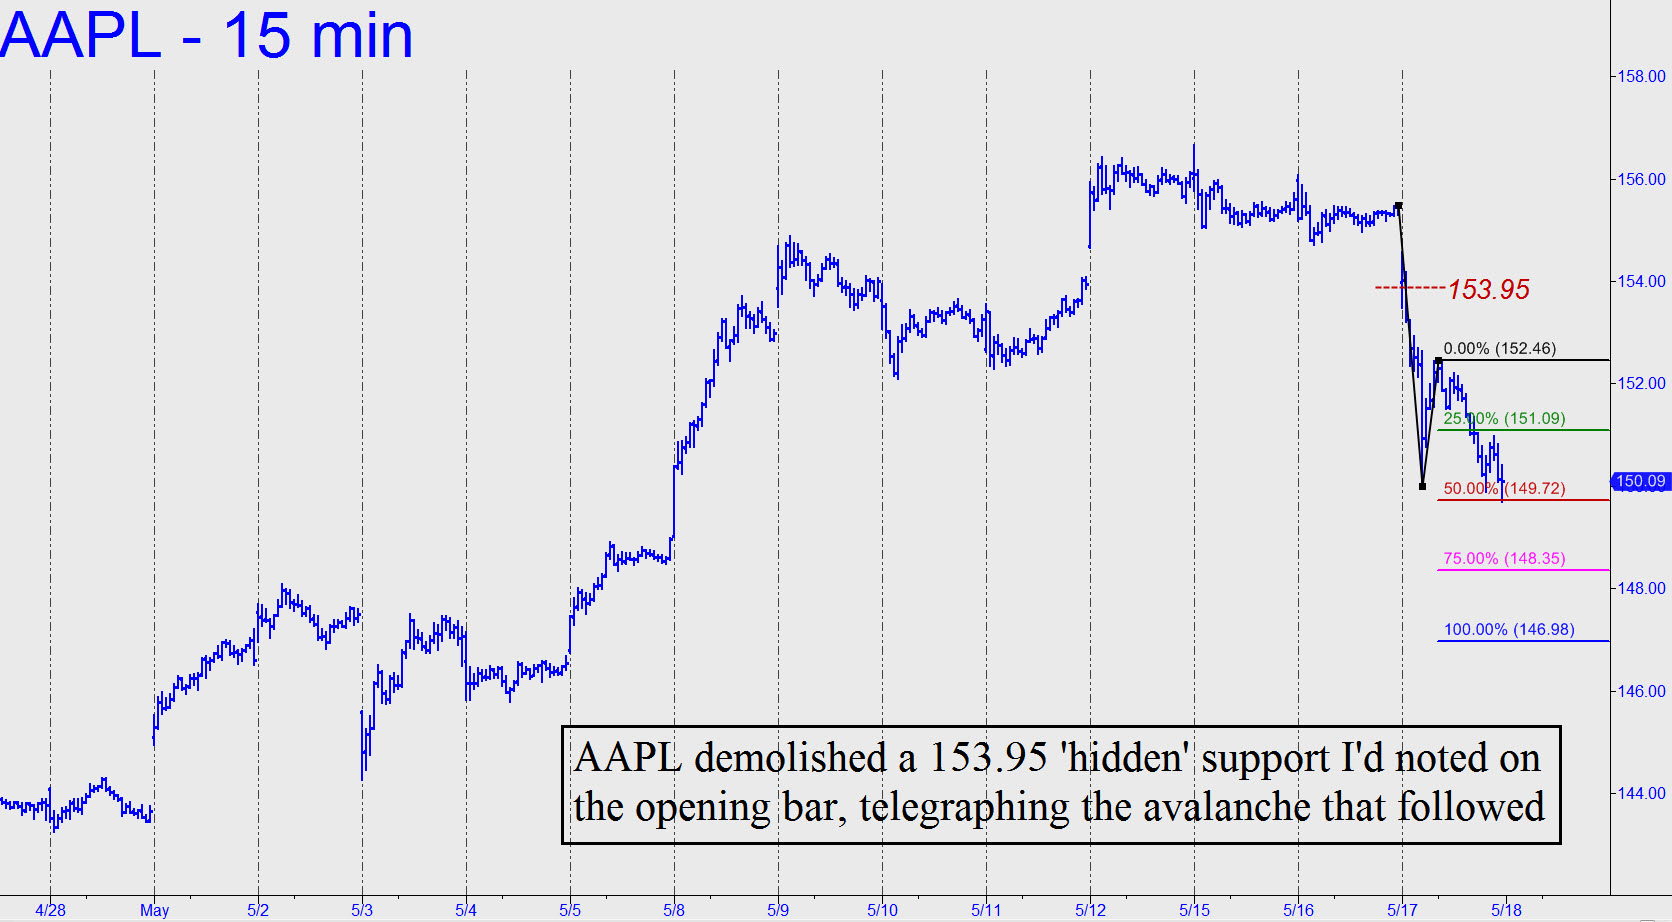
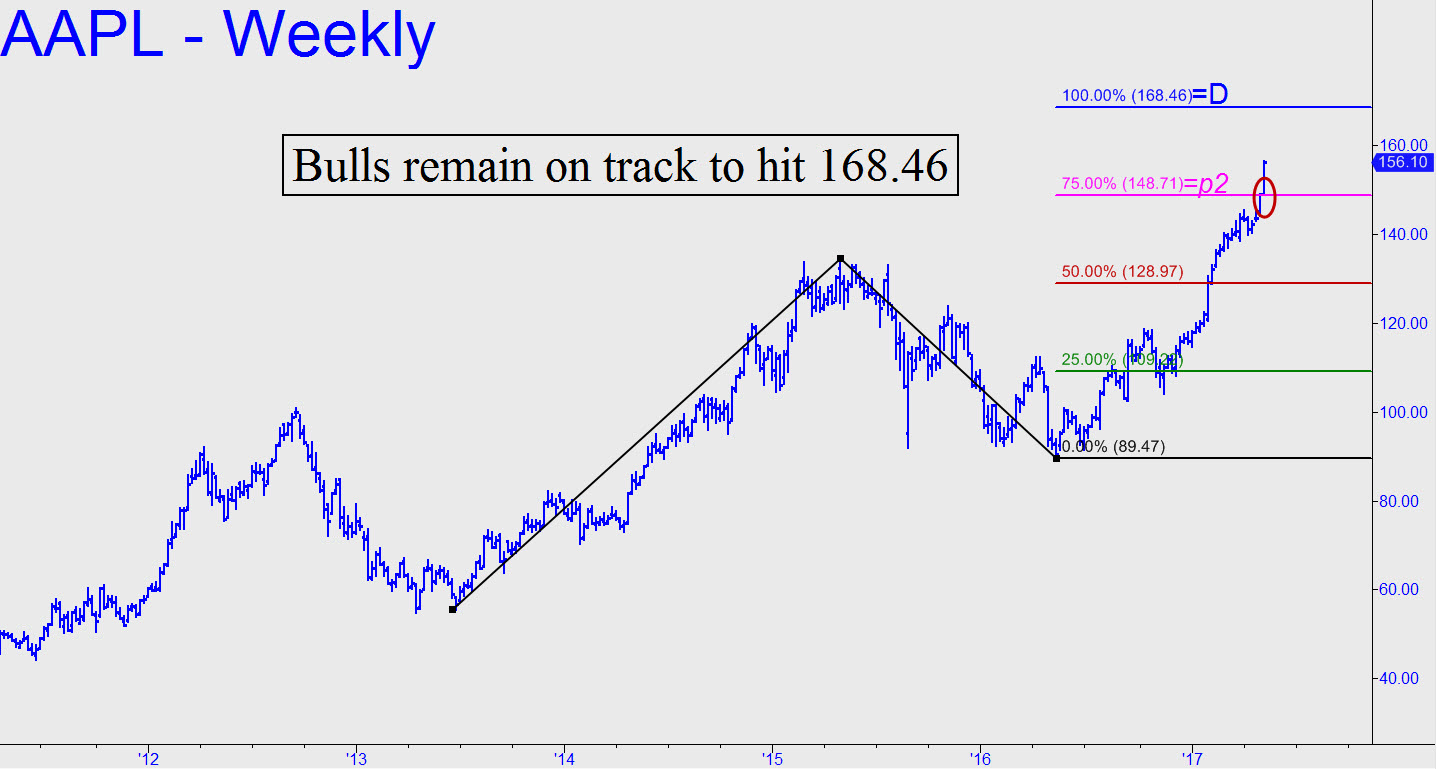
 The 168.46 target I’d said was ‘very likely’ to be achieved when the stock was still trading below $150 now looks like a lock-up. It comes from the weekly chart (see inset), although it could be subject to a short stall at 160.12, a Hidden Pivot calculated by using September’s 63.89 low as a point ‘A’ instead of June’s 55.55 bottom. More immediately, using the hourly chart, the rally will generate an additional target at 161.18 , just above the larger-degree pivot noted above, if it can get past the 156.65 midpoint pivot resistance shown in this chart. _______ UPDATE (May 16, 9:35 p.m.): The correction looks bound for 153.95 overnight, but if that Hidden Pivot support gives way easily it would portend more weakness during the regular session. Here are the coordinates for the target on the hourly chart: a=156.27 (5/16, 9:00 a.m.), b=154.72. _______ UPDATE (May 17, 7:04 p.m.): AAPL sliced through the 153.95 pivot on the opening bar, telegraphing the avalanche that followed. For now, use this pattern, with implied downside to as low as 146.98 over the near term, to guide you.