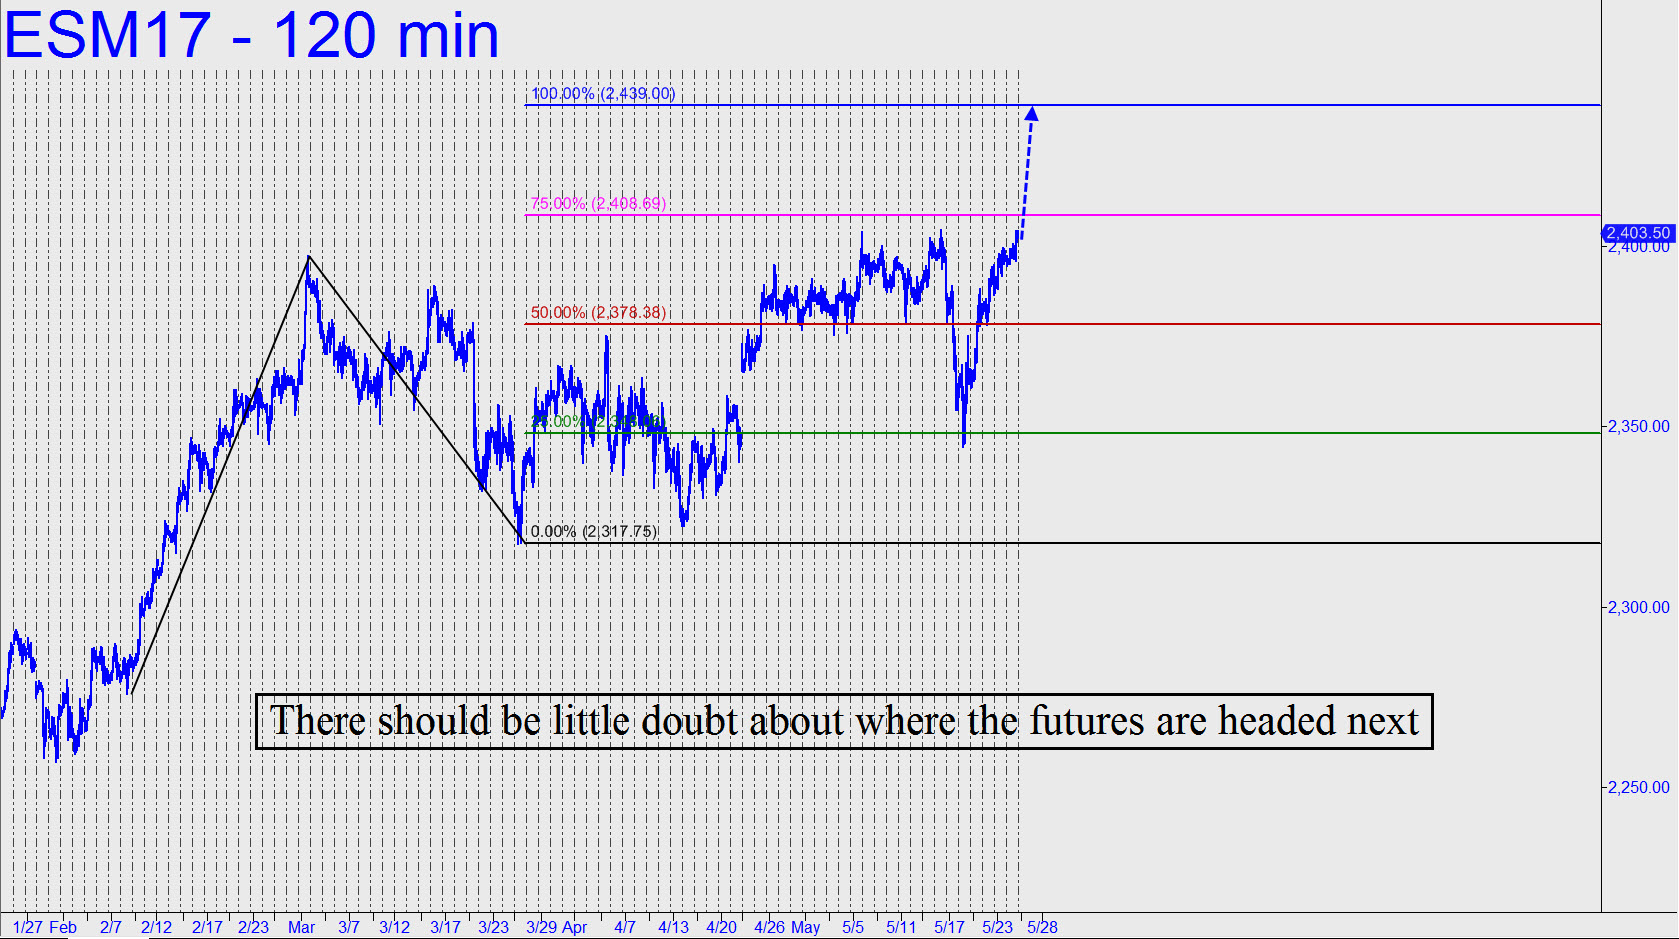
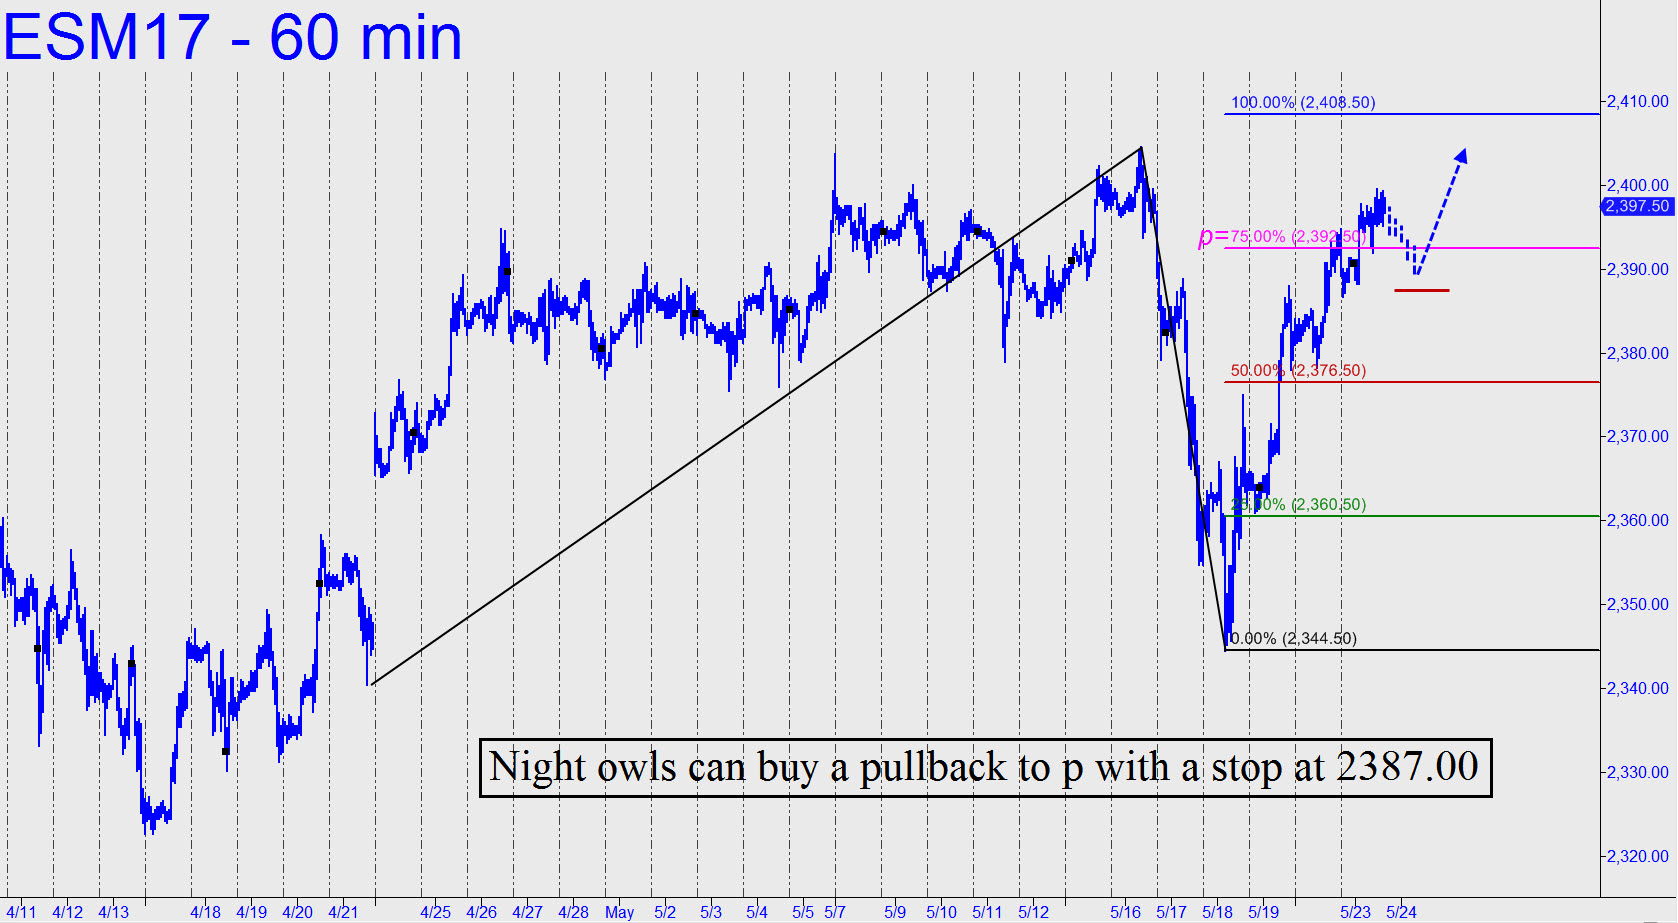
 Tuesday’s tight spasms turned a secondary pivot at 2392.50 from resistance to apparent support, presumably for an imminent thrust to the 2408.50 target shown (see inset). Any higher would indicate 2417.75, an alternative target that also was flagged here yesterday. Night owls looking for a belated entry opportunity can use a ‘mechanical’ bid placed at the pink line (2392.50). But with such a modest profit objective as 2408.50 in mind, the initial stop-loss would have to be a relative tight 2387.00. Exit most of the position if 2408.50 is achieved, but keep a small piece of it for a shot at 2417.75 or higher. _______ UPDATE (May 24, 7:47 p.m. ET): This chart stretches the immediate rally threshold to 2439.00, but you should be prepared for a stall or possibly even a reversal from either of the Hidden Pivot resistance points note above in green. _______ UPDATE (May26, 1:10 a.m.): I still like the 24339.00 target — not just as a minimum upside target for the near term, but as a place to get short with a stop-loss as tight as 2340.25 if it’s hit near the end of Friday’s session. You should do so without trepidation if you’ve been long for at least a part of the implied 28-point rally. A ‘mechanical’ bid at p2=2408.50 can be used to get aboard, assuming you are comfortable with the tactic. Be prepared for a stall at the 2417.75 pivot noted above.