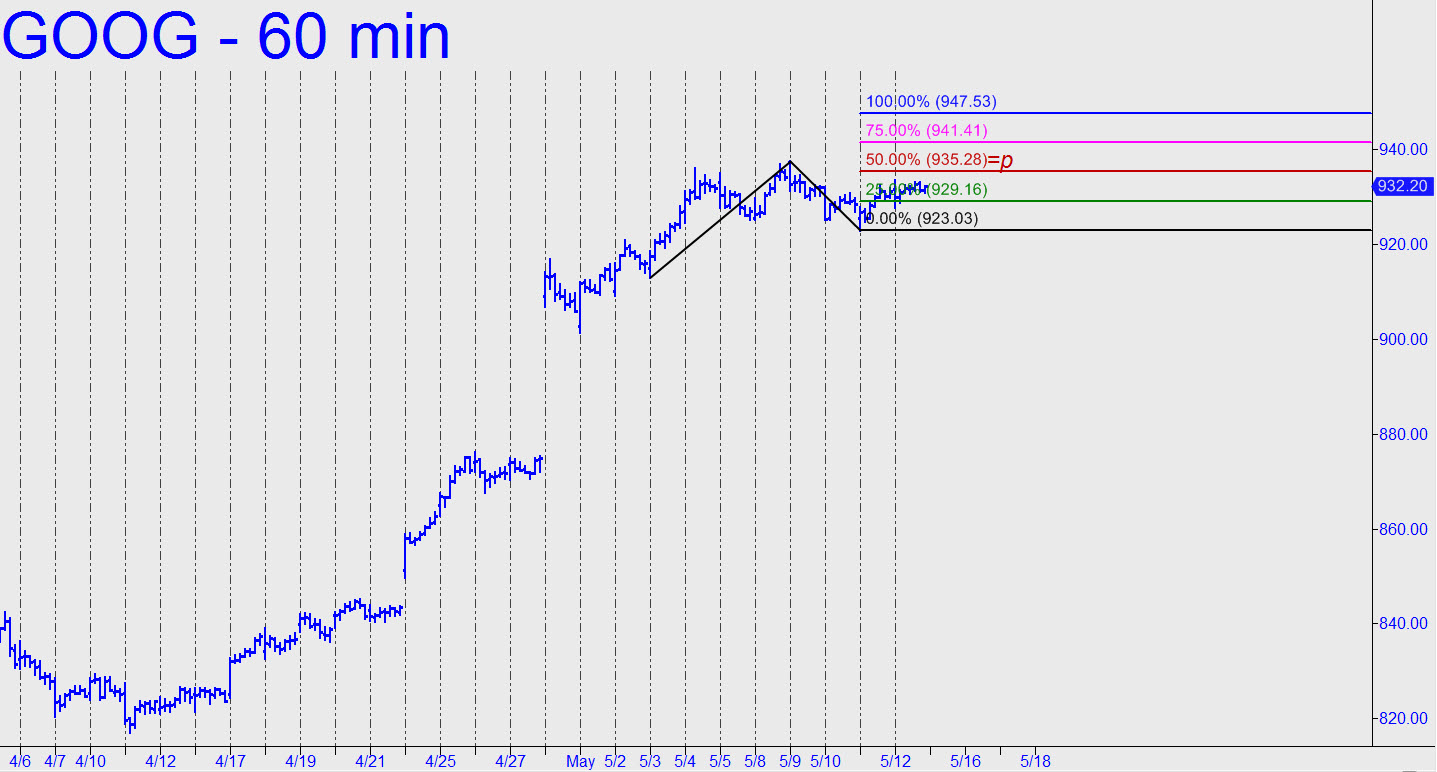
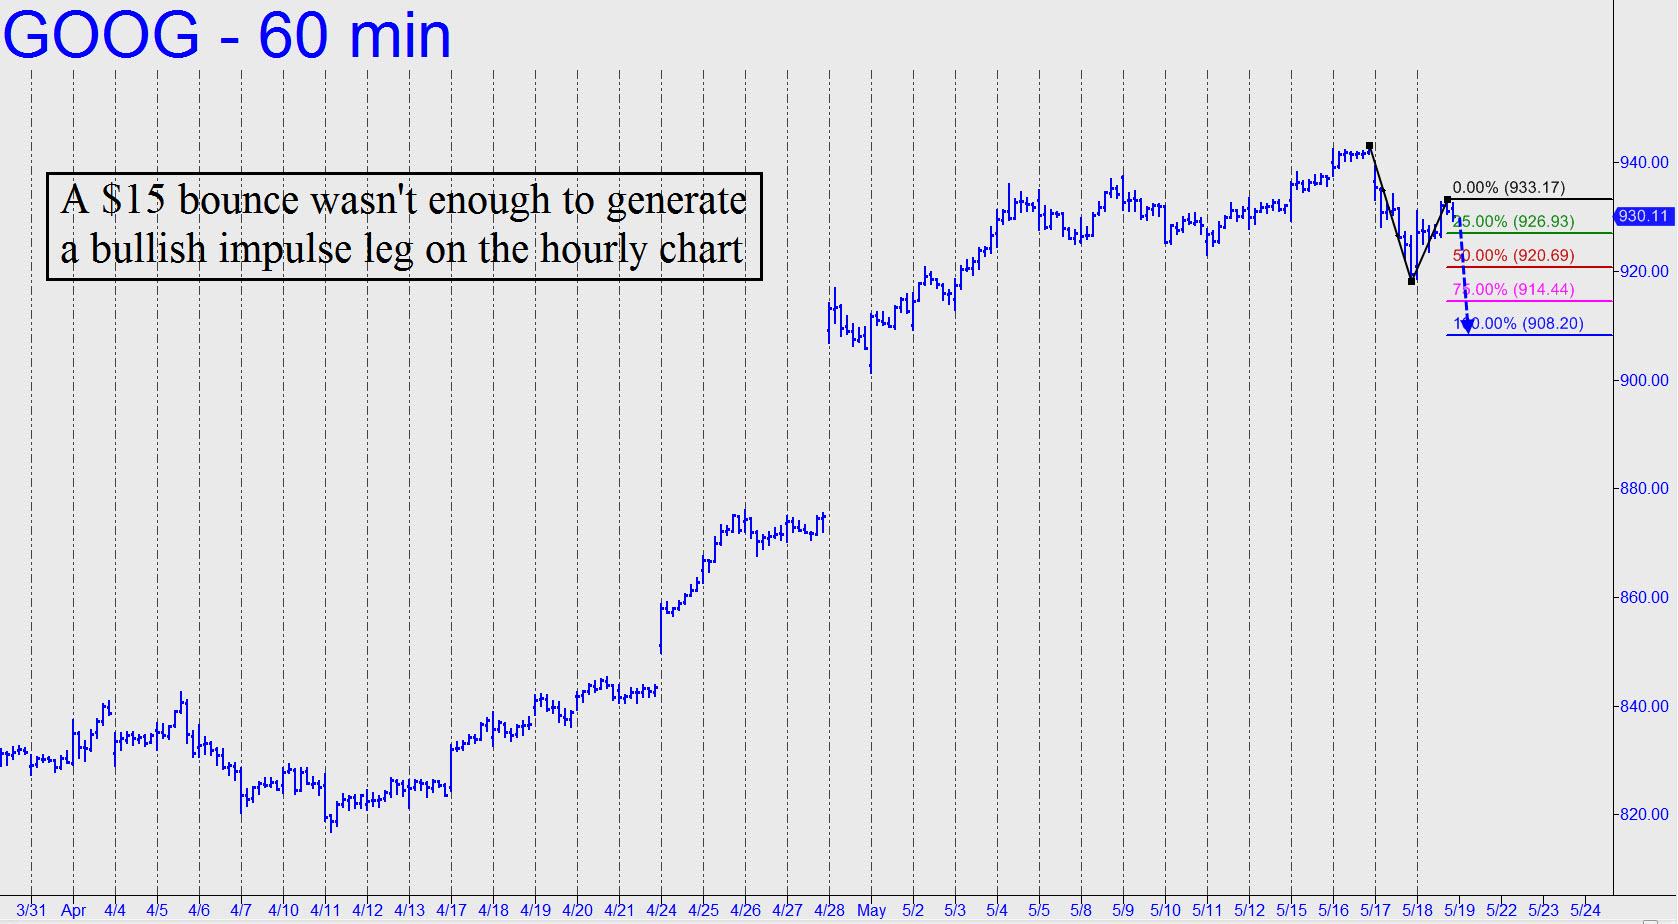
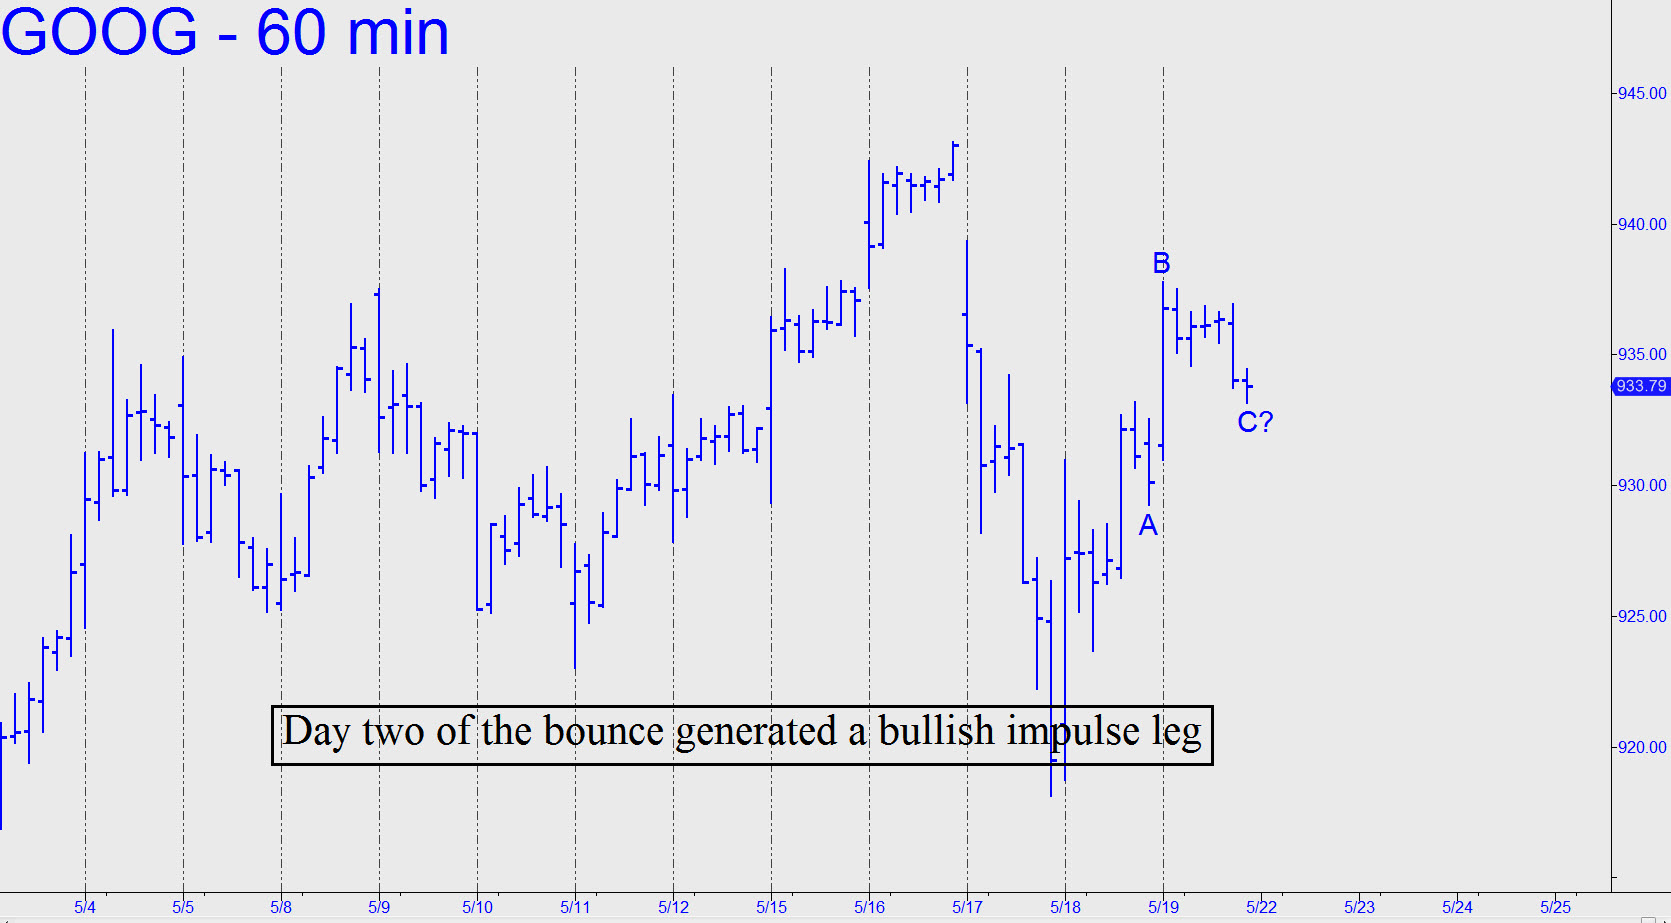
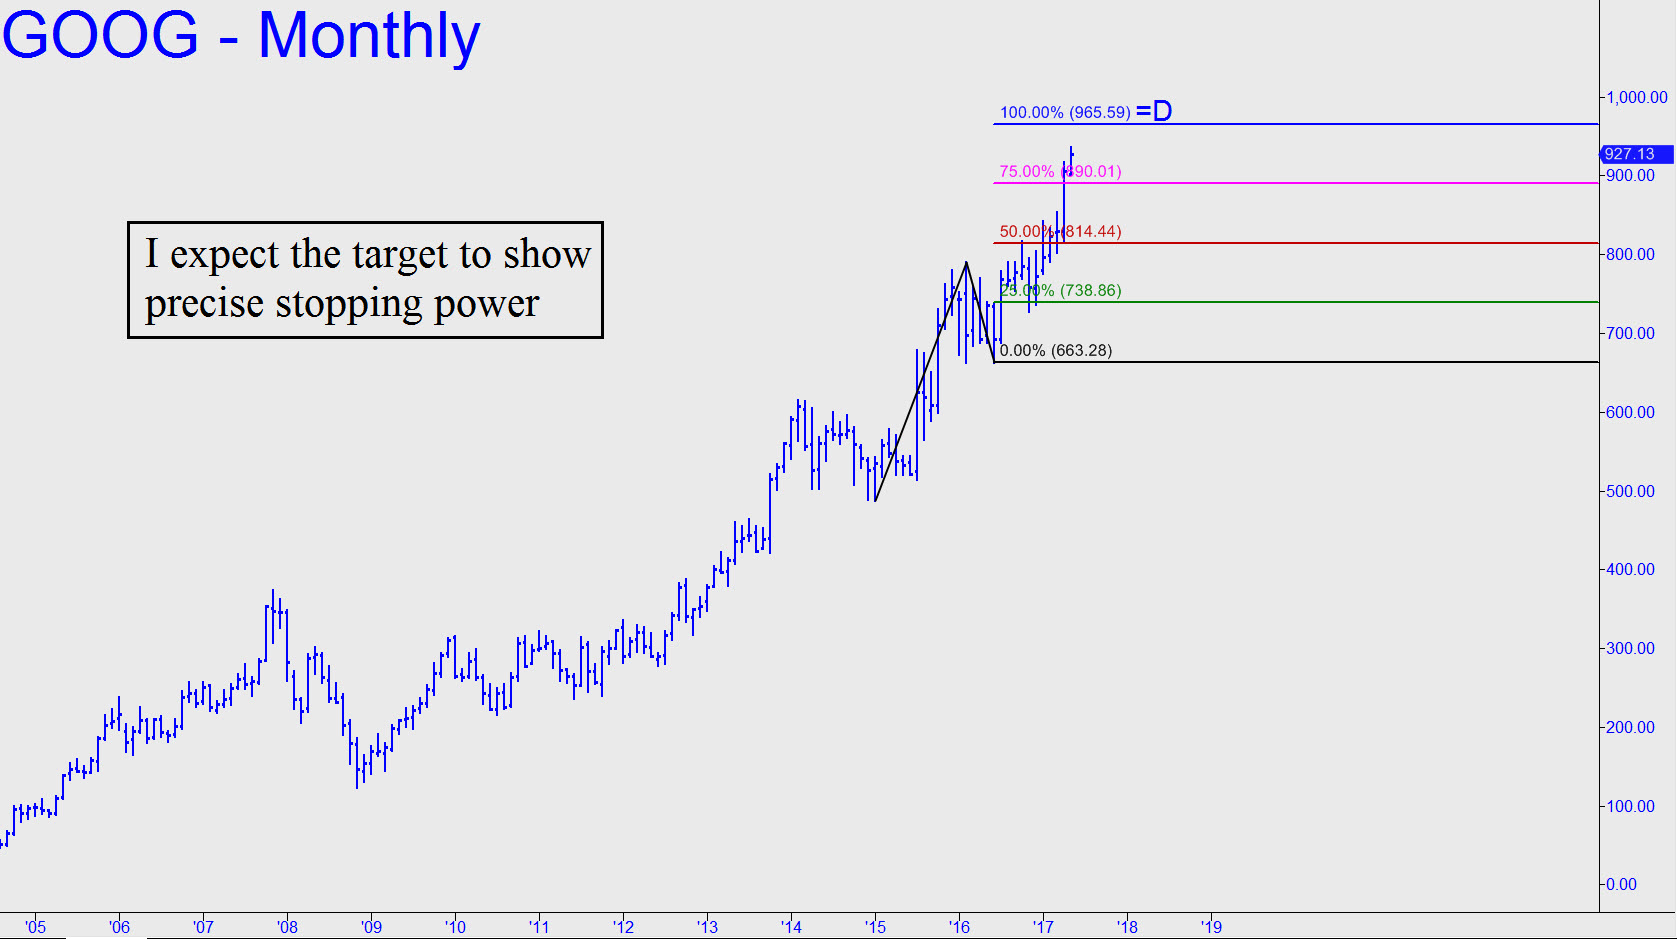
 Focusing on a 937.97 target for the last several weeks has kept us comfortably on the right side of the trend. I’d suggested shorting at the number, a Hidden Pivot resistance, on Friday, but because the stock missed it by 2.04, there would have been no trade. It is still short-able, but you should attempt it only if you’ve caught a profitable piece of the ride north, and even then with put options tied to a tight stop-loss. Otherwise, we’ll give the stock a little more running room, using the new target shown, at 965.59. It has greater clarity and appeal than the one at 937.97, so we’ll be looking more aggressively to get short there if and when the time comes. _______ UPDATE (May 10, 7:58 p.m.): GOOG generated a bearish impulse leg on the intraday charts today, but it would only begin to become menacing, albeit slightly, with a plunge exceeding the minor Hidden Pivot target at 923.48 shown in the chart. (See my most recent update for AAPL, which is in a similar situation.) _______ UPDATE (May 14, 11:18 p.m.): GOOG has bounced $10 after making a low cents 43 from the 923.48 target identified above. Now, use the 935.28 midpoint pivot shown (click here) as a minimum upside projection and key resistance for Monday. An easy push past it, and particularly a close above it, would make a run-up to the 947.53 target an odds-on bet. _______ UPDATE (May 17, 11:05 p.m.): We’ll want to pay close attention to the way GOOG interacts with the 914.34 pivot shown in this chart. It is my minimum downside target at the moment, but if it’s exceeded by more than a couple of bucks, that would hold bearish implications not only for the stock, but for the Nasdaq Index and the stock market as a whole. (Note: Today’s updates for AAPL and AMZN raise the same point using equally precise benchmarks.) _______ UPDATE (May 18, 9:09 p.m.): GOOG has rallied 15 points off Wednesday’s low, but it still wasn’t enough to generate a bullish impulse leg on the hourly chart. If the stock rolls over after having gone no higher than 933.17, my minimum downside target would be 920.69 (click here for chart). That’s the midpoint Hidden Pivot support of the pattern shown, and its breach would portend more slippage to as low as 908.20. _______ UPDATE (May 21, 6:05 p.m.): The stock has rallied sharply after penetrating the 920.69 pivot by more than $2, generating a bullish impulse leg on the hourly chart in the process. I’ve sketched a potentially tradable pattern for Monday, but this one would be for nimble Pivoteers only, since it’s impossible to say in advance how the abc’s will shape up.