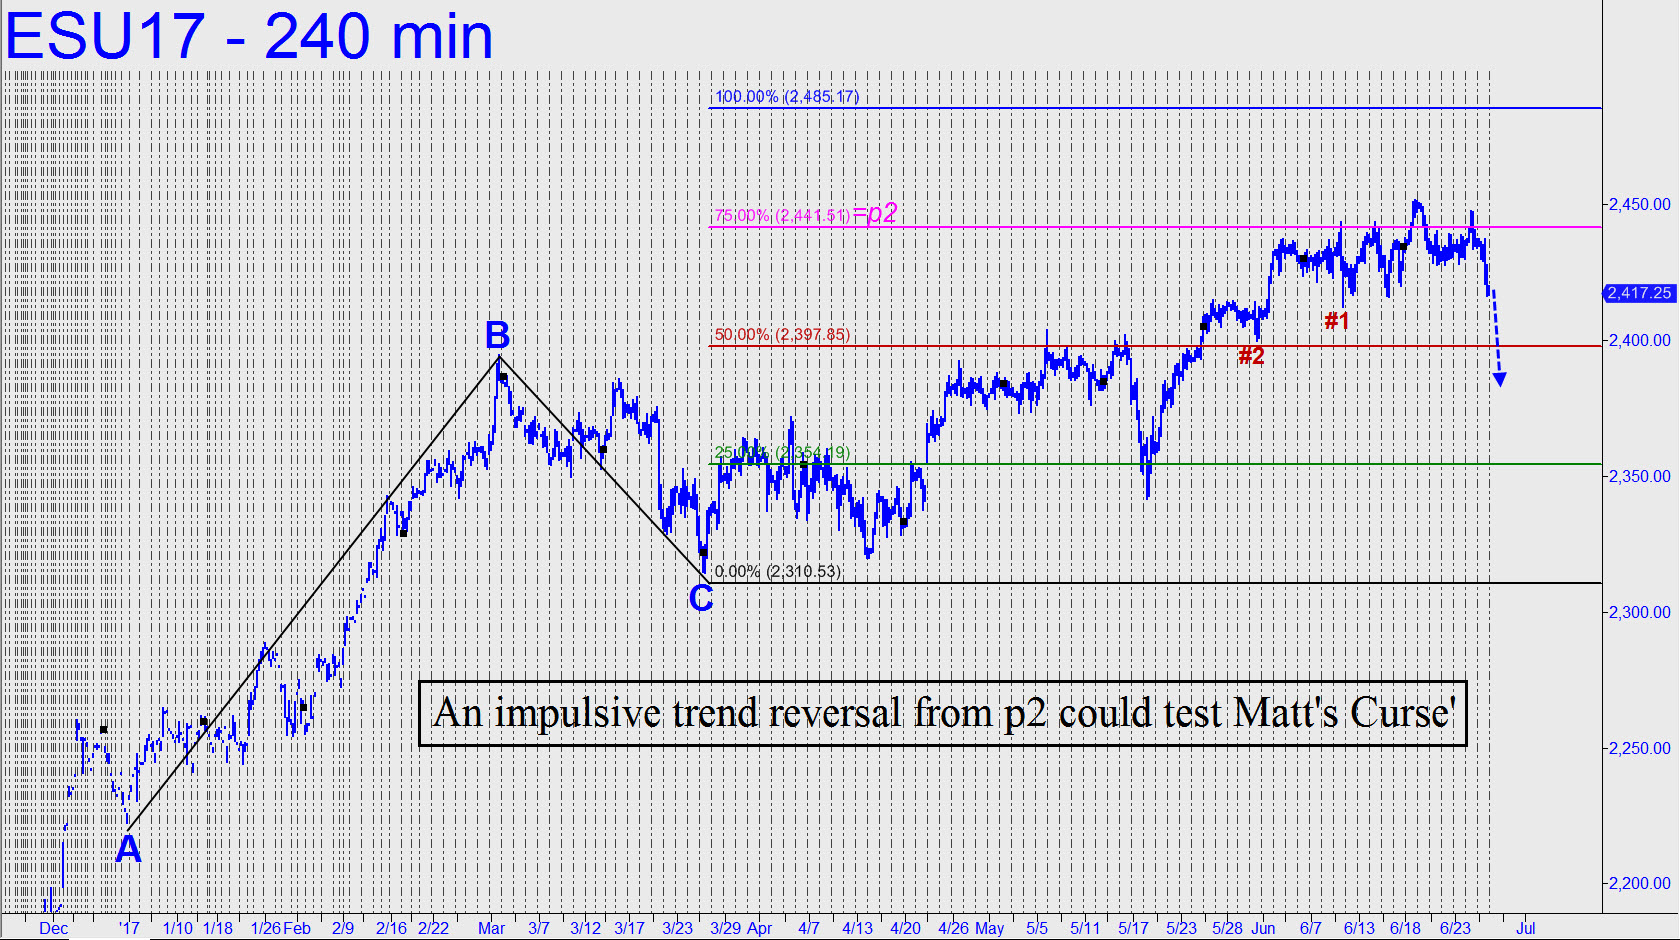
 There are two major ‘structural’ supports between here and 2400, and if they are breached within the next day or two, especially without a clearly discernible upward correction on the 240-minute chart shown (see inset), that would be something new and different technically speaking. For in fact, it would generate a bearish impulse leg of a degree not seen in 2017, or even in 2016. It would also activate ‘Matt’s Curse,’ which, according the subscriber who coined the term, holds that any rally that fails decisively at p2, the ‘secondary pivot’, is in danger of falling beneath the pattern’s point ‘C’ low — in this case 2310.53. It turns out that this same set-up is occurring in numerous other stocks and indexes that we follow. Could we be about to find out whether Matt, an inveterate trader of Silver futures, has discovered an indicator that will rank right up there with the recently confirmed, uber-bearish ‘Hindenburg Omen’?
