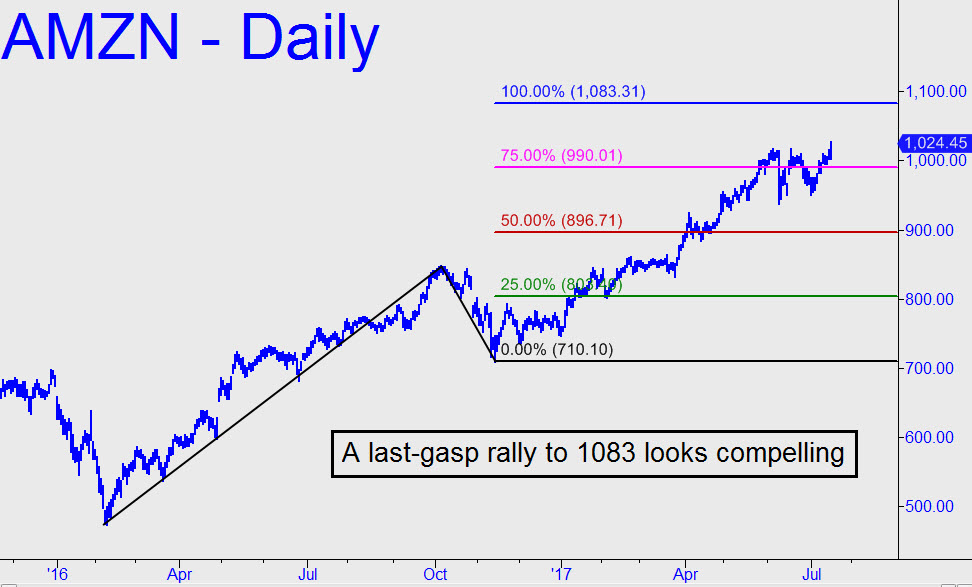
 With no help from the broad averages, AMZN, the locomotive of the global bull market, chugged higher on Tuesday, demolishing a Hidden Pivot resistance at 1018 with ease. This implies the stock will reach a minimum 1083 before it hits solid resistance. Because it will have taken AMZN at least 17 months to get there, we should expect a tradeable and perhaps very significant pullback. In the meantime. we should also expect the broad averages to move higher as AMZN drags them in its wake. If the stock reaches 1083 before the week ends it would be a blowoff worthy of the name. Your trading bias should remain bullish until such time as the target is reached or the stock generates a bearish impulse leg on the hourly chart._______ UPDATE (Jul 20, 12:01 a.m.): AMZN did in fact create a bearish impulse leg on the hourly chart, so the yellow flag is out. This is the first negative sign we’ve seen on the ’60’ since the stock pushed into record-high territory earlier in the week. If the selling continues, exceeding 1004.00 to the downside over the next 2-3 sessions, the recent all-time high at 1034.97 could take on new importance. _______UPDATE (Jul 24, 5:26 p.m.): Fall below 1004? What on earth were we thinking!? The stock swam strongly against the tide Monday, peaking with a $17 rally when the Dow was down more than 80 points. The 1083 target remains viable, but because the intraday high occurred almost precisely at the 1041.97 Hidden Pivot resistance of a lesser pattern (60-min, A= 1004.00 on 7/18), caution is still warranted. However, if the stock blows higher, 1070.64 (60-min, A=884.49 on 4/13) can be used as a minimum upside objective. ________UPDATE (Jul 27, 1:03 p.m.): AMZN has plummeted $33 today after hitting a major, 1083.31 target I’d drum-rolled seven weeks ago to the exact penny. Here is my tout from June 4:
“We’re using a 1018.73 rally target for AMZN, the only stock we need to watch closely if we want to get the stock market right. You can bet that as long as the retail giant’s shares are headed higher, any predictions about a crash on Wall Street will be premature at best and distracting at worst. Notice that there is yet one more rally target to use if this one gets obliterated: 1083.31. A move to that Hidden Pivot would be the culmination of a bull cycle that has taken 16 months so far to unfold.”
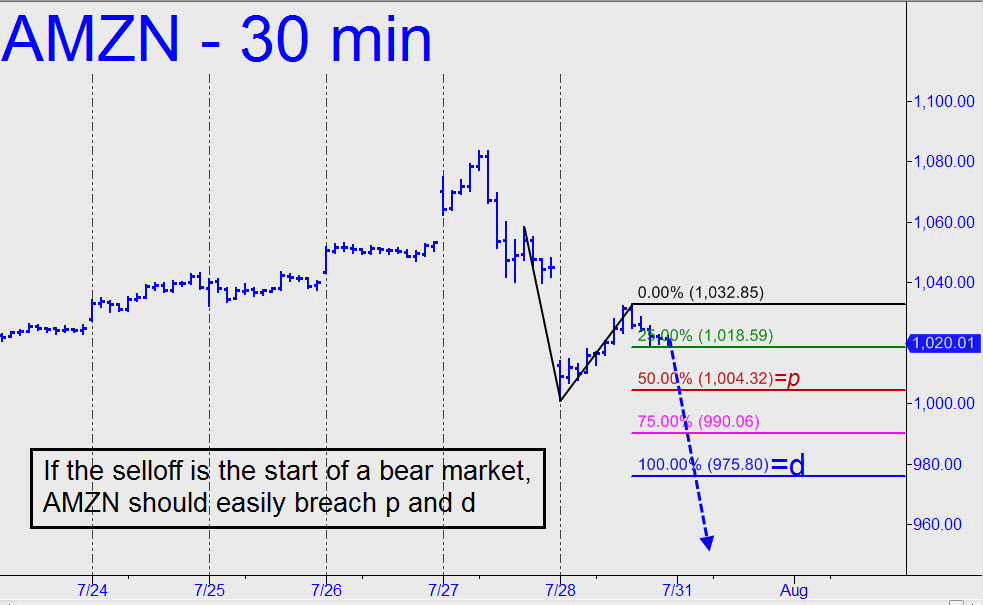
Obviously, this could mark a very important top — not just for the shares of the most important company in the world, but for the global bull market in stocks. We’ll monitor further developments closely, to be sure._______ UPDATE (Jul 27, 5:58 p.m.): AMZN extended its plunge in after-hours trading to 1001, meaning it has fallen $82 since having topped to-the-penny at my 1083.31 target. Suspiciously, the Dow has not followed._______ UPDATE (Jul 30, 6:30 p.m.): The stock’s reversal from an important rally target has been dramatic and is bearishly impulsive on the hourly chart. We’ll be better able to determine if it’s going to get legs once we’ve seen a second leg down. I’d suggest using the pattern shown for that purpose. It has a 975.80 target that will remain valid unless AMZN hiccups above the point ‘C’ high at 1032.85. If the selloff is in fact the first stage of a full-blown bear market, we should see it penetrate both p=1004.32 and d=975.80 decisively and with ease._______ UPDATE (Jul 31, 9:54 a.m.): The stock has just bounced $5 from within three pennies of a 1004.32 correction target I’d posted in the chat room. This is ostensibly bullish price action, but the move would need to hit 1022.35 before bulls can safely infer that the worst is over. Alternatively, if AMZN decisively breaches the 1004.32 Hidden Pivot support, it would be telegraphing more downside to exactly 975.80. You can locate this target on the 5-minute chart using a= 1058.05 (7/27). _______ UPDATE (Jul 31, 8:45 p.m.): Sellers trashed the 1004.32 support, greatly shortening the odds of a further fall to exactly 975.80.