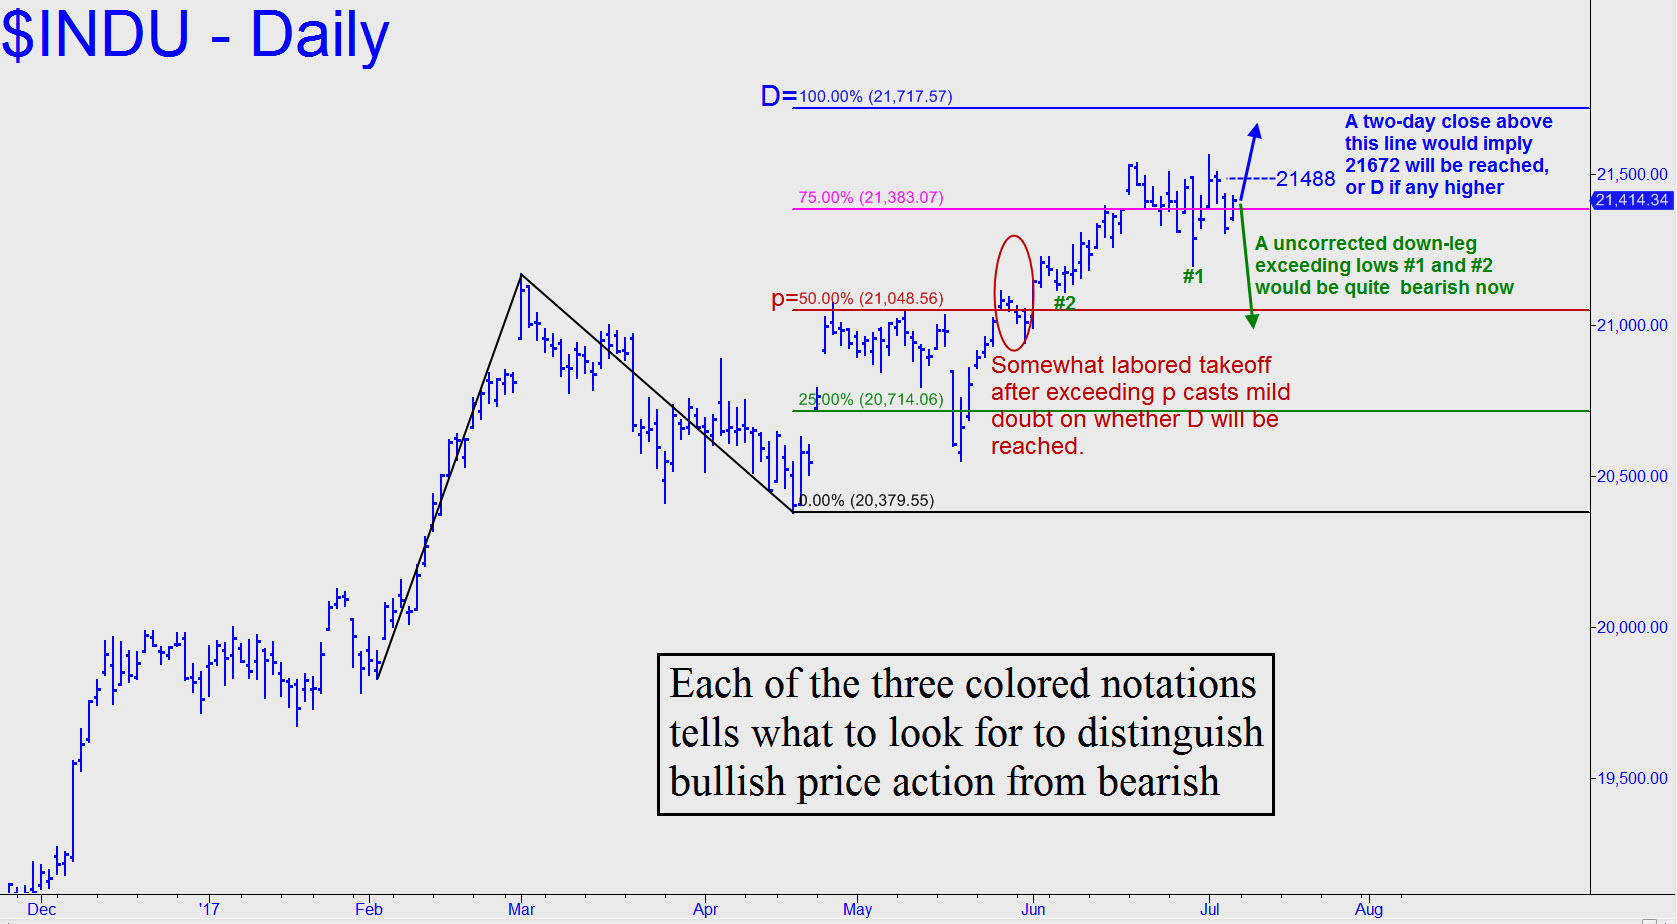
 I am featuring the Dow Industrials in today’s touts because the rally pattern shown (click on inset) looks so perfectly predictable, or very nearly so. My only concern with respect to the question of whether the Dow will reach a ‘D’ target at 21763 that lies 350 points above is that the initial move through the 21048 midpoint pivot did not go very far before it needed a correction and a running start to reach the next Hidden Pivot level, a secondary pivot at 21383. I have little doubt that if the Indoos reach the higher number, they will stall there very precisely and pull back in a way that will be tradeable. However, because of the hesitation following the initial move through p=21048, the ability of the Dow to achieve the target is mildly in doubt. The most bearish thing that could happen next would be for the Indoos to fall in such a way that the two external lows shown, respectively 21197 and 21113, are exceeded to the downside with no intervening upward correction. Alternatively, bulls would hold sway if they can close this vehicle above 21488 for two consecutive days. That is the midpoint pivot of a bullish pattern comprising the last five price bars on the chart. All of this may be making your head spin, but I’ve sketched it graphically because it’s important that you know exactly what’s going on, and that you are able to follow price action knowledgeably as things unfold over the course of the week.
