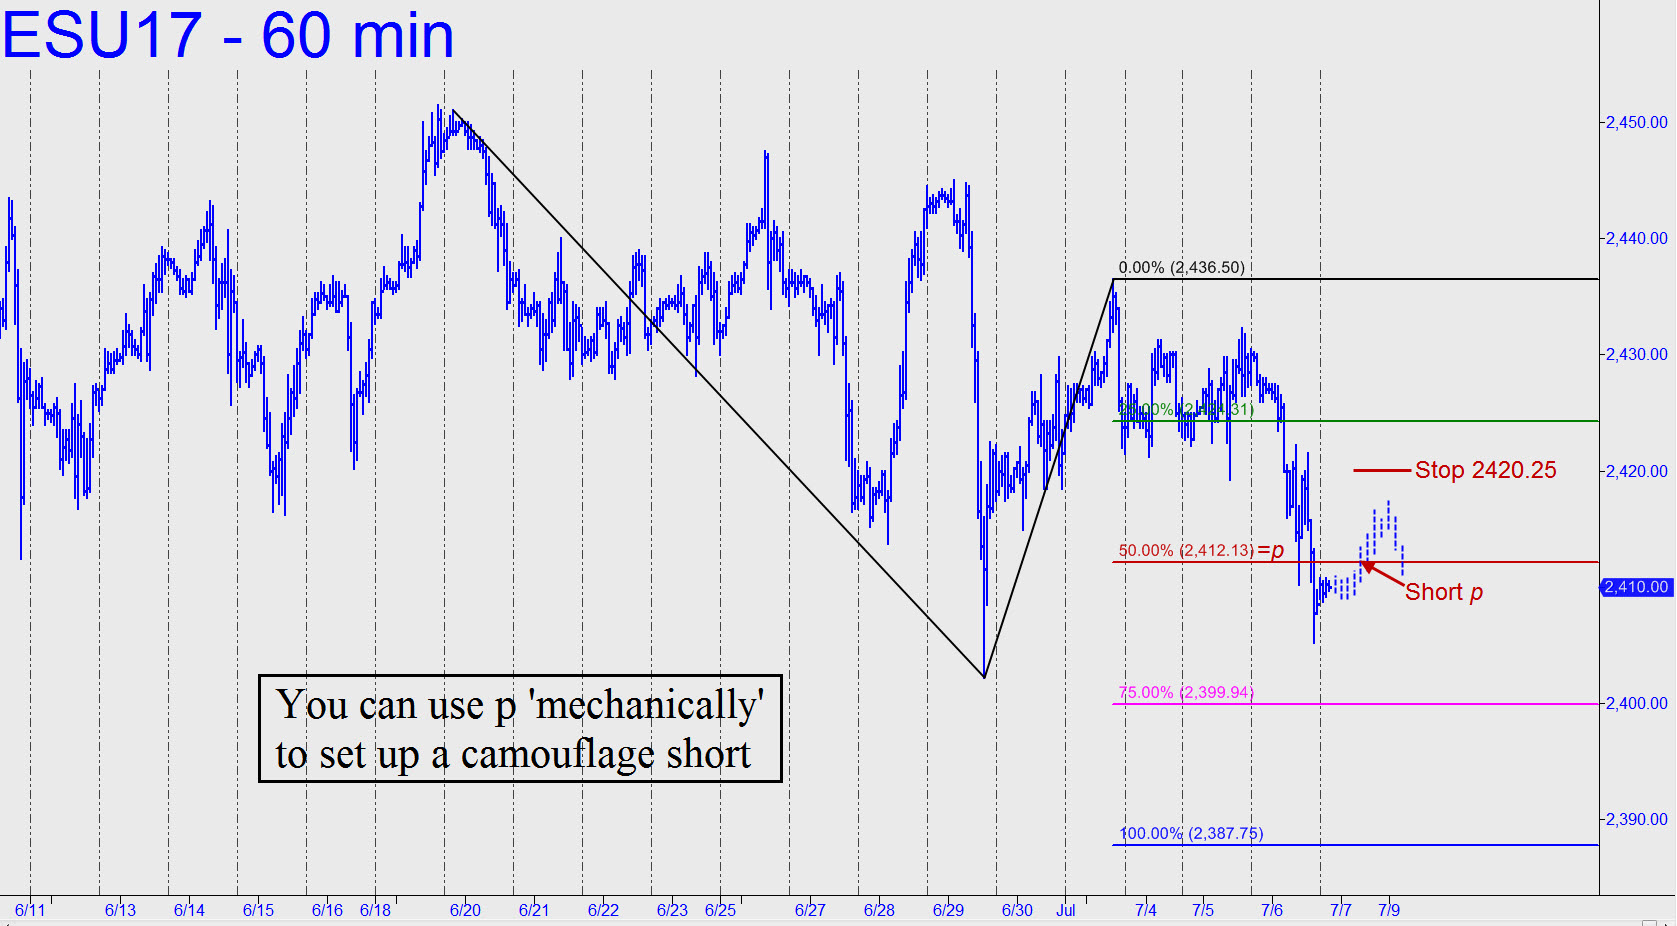
 The gnarly looking pattern shown is the one I’d suggested using at the moment. It implies a further fall of of 22 points from current levels to exactly 2387.75. I consider this likely because of the way in which the decline shredded the 2421.13 midpoint Hidden Pivot support. The target is somewhat lower than the one given here earlier at 2394.00, but I’m more comfortable with it because the pattern itself is not nearly as obvious. To get short, offer a single contract ‘mechanically’ at 2412.25, stop 2420.25. To cut the implied $400 entry risk by as much as 90%, I’d strongly recommend using a ‘camouflage’ set-up on the three-minute chart. That implies shorting the first downtrending abc pattern that perfectly meets our criteria once 2412.25 has been touched by a rally. I’ve sketched this hypothetically for your further guidance.________ UPDATE (Jul 9, 6:04 p.m.): Friday’s jerky uptrend generated nary a single bearish impulse leg, even on the three-minute chart, so I’ll assume nothing was done on the order. If you took the more risky ‘mechanical’ trade, however, the single-contract loss would have been about $400. Now, the subsequent rally to the green line at 2424.31 has tripped another ‘mechanical’ sell signal, but the same guidance obtains: in ‘camouflage’ fashion, short only a downtrending abc that meets our criteria for this type of trade. In any event, the implication of the foregoing is that the rally will still fail somewhere shy of the point ‘C’ high at 2436.50, and that the futures will subsequently fall to the 2387.75 target shown. If ‘C’ is exceeded to the upside, however, it would strongly indicate that yet another short squeeze, presumably to new record highs, is under way.
