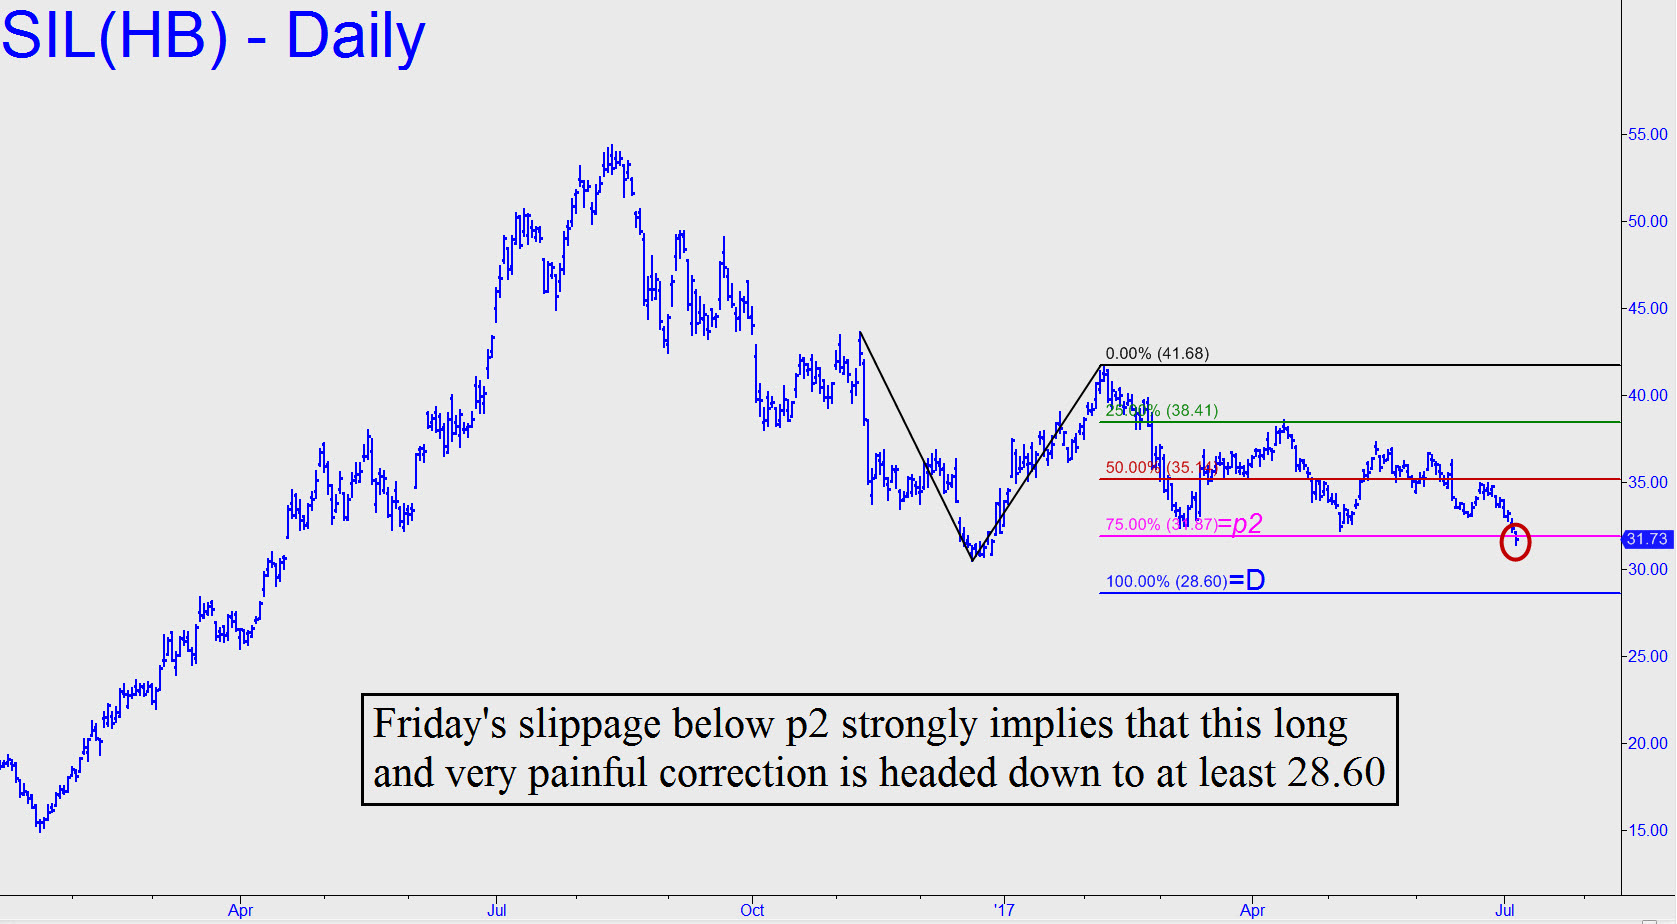
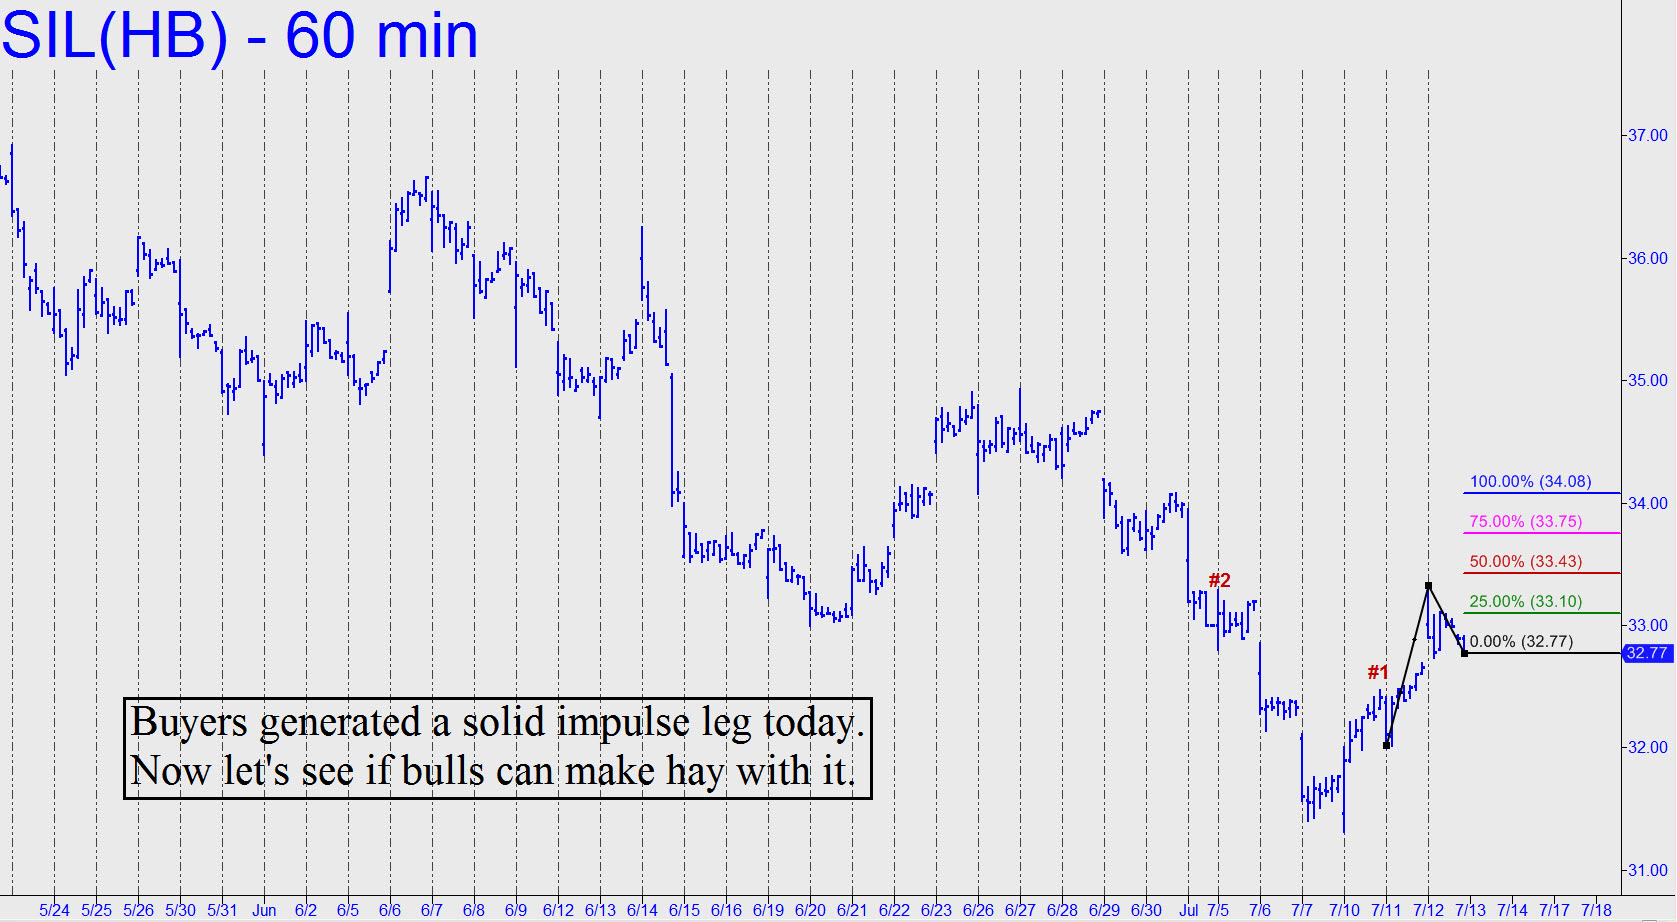
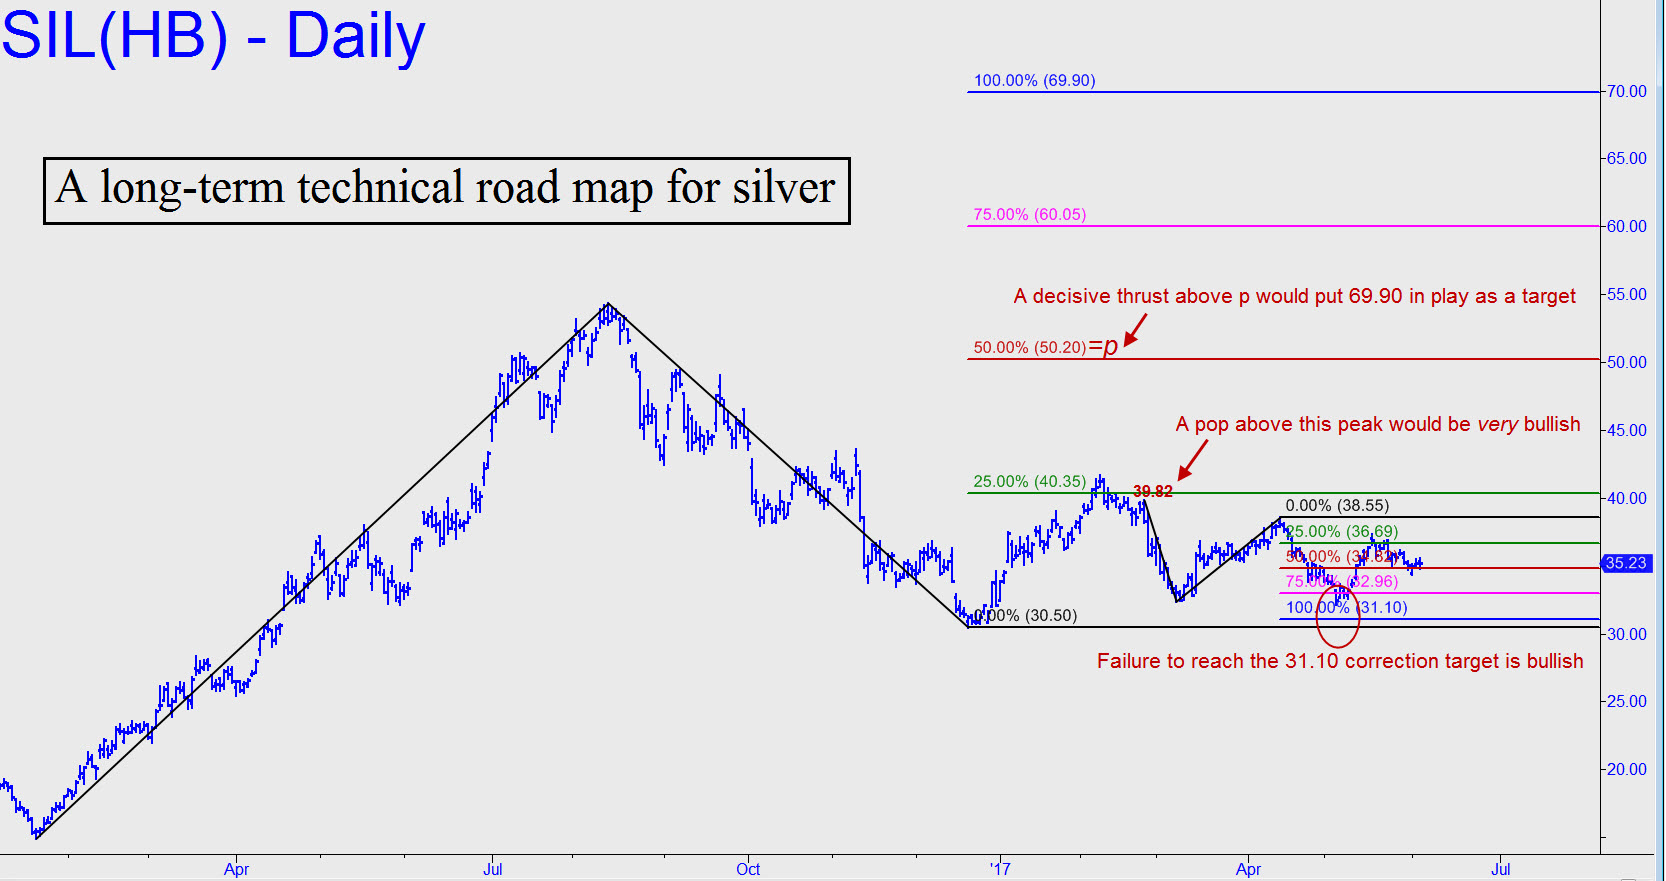
 Since August, SIL has been correcting a major bull leg that took it from 14.94 to 54.34 between January and August of 2016. The current phase of the correction began on February 24, and it should have bottomed at 31.10 a month or so ago. Instead, SIL turned sharply higher from 32.21 — i.e., from 1.11 above the target — and has since gone as high as 37.30. It is usually a bullish sign when an abcd correction fails to reach its ‘d’ target, but we cannot be confident about this until the reaction move has surpassed at least a couple of ‘external’ peaks, as has in fact occurred here. Even so, I wouldn’t break out the bubbly until such time as SIL pops above the 39.82 ‘external’ peak that I’ve labeled in the chart. That would strongly imply that the larger, ABC uptrend begun in January 2016, with a bull-market target at 69.90 (!), had resumed. Even then, however, we would need to see a decisive pop above the 50.20 midpoint Hidden Pivot before we could infer that 69.90 was an odds-on bet to be achieved. Regardless, 50.20 would become our minimum upside objective at that time. Alternatively, my worst-case target for the correction begun in August from 54.34 would be 28.60. It is calculated by using November 9’s 43.58 peak as the point ‘A’ high of the downtrend._______ UPDATE (Jul 9, 6:07 p.m. EDT): SIL slipped beneath a key Hidden Pivot support at 31.87 on Friday (click here to see chart). greatly shortening the odds of a further fall to at least 28.60. This number, a major Hidden Pivot support, was first broached here more than a month ago as my worst case target for the correction. This will be a very appealing spot to try bottom-fishing with a tight stop-loss, but you should trade initially with the goal of making a few points on the short side before you get too jazzed about the countertrend opportunity._______UPDATE (Jul 11, 8:15 p.m.): SIL ended the day with the creation of a fresh, bullish impulse leg on, if not the hourly chart, then at least the 30-minute. The rally targets 33.17, and it should get there, since the close was above the midpoint pivot at 32.60. What bulls should prefer to see, however, is a thrust that blows past 33.17, generating yet another impulse leg by exceeding a 33.29 ‘external’ peak recorded a week ago on the way down.______ UPDATE (Jul 12, 10:15 p.m.): SIL did everything we asked of it today and more, firming up the bullish case for the near term. Now, if it can exceed the ‘d’ target of whatever abc pattern takes shape (click here for chart), surpassing yet another external peak on the hourly chart, we could take some small encouragement. It’ll require a print at 34.94, however, to suggest that bulls may be turning things around. _______ UPDATE (Jul 13, 6:53 p.m.): The futures pulled back from Wednesday’s peak, but the bullish impulse leg is intact. Traders looking to get long should focus on the hourly chart, where a point ‘c’ low occurring just above Tuesday’s 32.02 low could conceivably set up a ‘counterintuitive’ entry trigger.