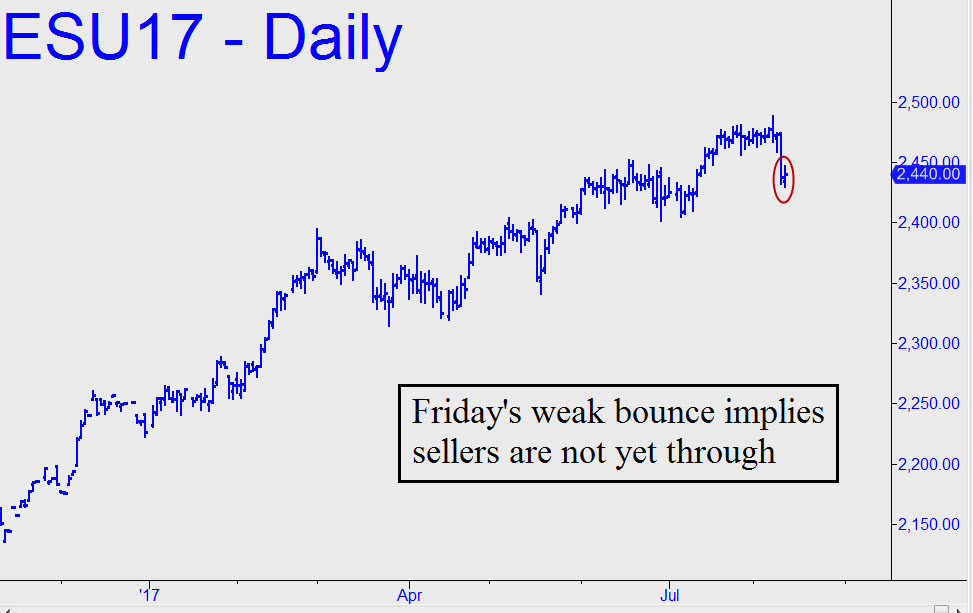
 Friday’s weak bounce from a marginal new low suggests the selloff begun last Tuesday from a record peak at 2488.50 has farther to go. That high fell within a hair of two Hidden Pivot resistance points I’d flagged here the night before, one major, the other minor. That’s why we should be prepared for a correction of greater duration than we’ve come to expect in 2017. If it exceeds the 2402.25 low from 6/29, the damage would begin to look serious on the daily chart. Regardless, bulls could short-circuit the correction process with an upthrust exceeding 2453.50, equal to an ‘external’ peak made Thursday on the way down. That would generate a bullish impulse leg on the hourly chart. If this were to occur early in the session, it would likely put buyers back in charge for the duration if not necessarily the week._______UPDATE (Aug 14, 7:32 a.m.): A nasty short squeeze off Friday’s 2430.25 low has generated a bullish impulse leg on the hourly chart this morning, but I seriously doubt the futures will hit a new record high on this move. That would change, however, if the rally were to exceed 2474.50, equal to an ‘external’ peak recorded last Wednesday that lies 14 points beneath the all-time high made a day earlier. ________UPDATE (Aug 15, 6:36 p.m.): Today’s high missed my benchmark by a point-and-a-half. Bulls will have another shot at it on Wednesday. Let’s see how they do._______ UPDATE (August 16, 6:15 p.m.): Yet even closer, but still no cigar. Nudge me in the chat room if I seem to have fallen asleep. A drop below 2450.00 now would hint of trouble.
