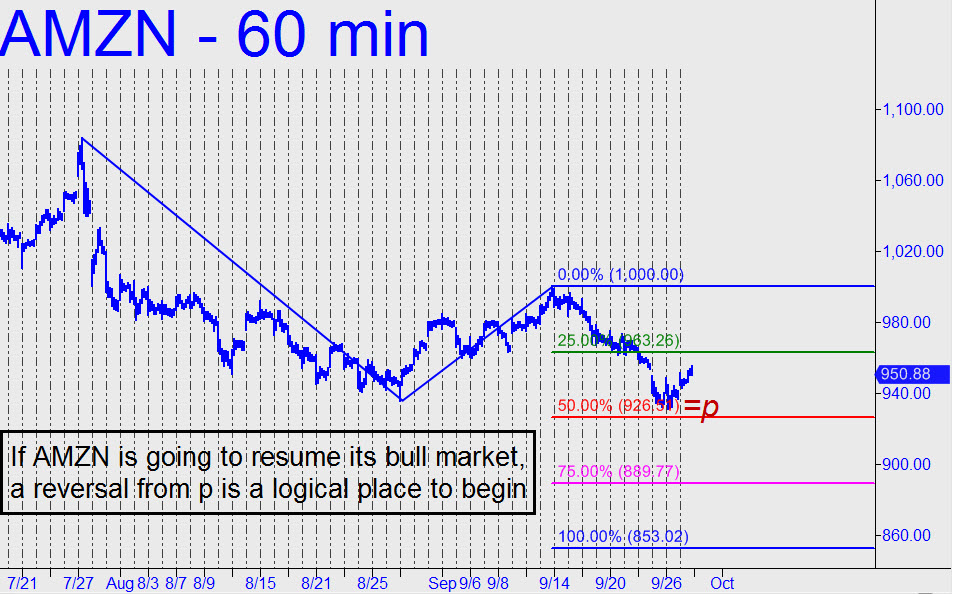
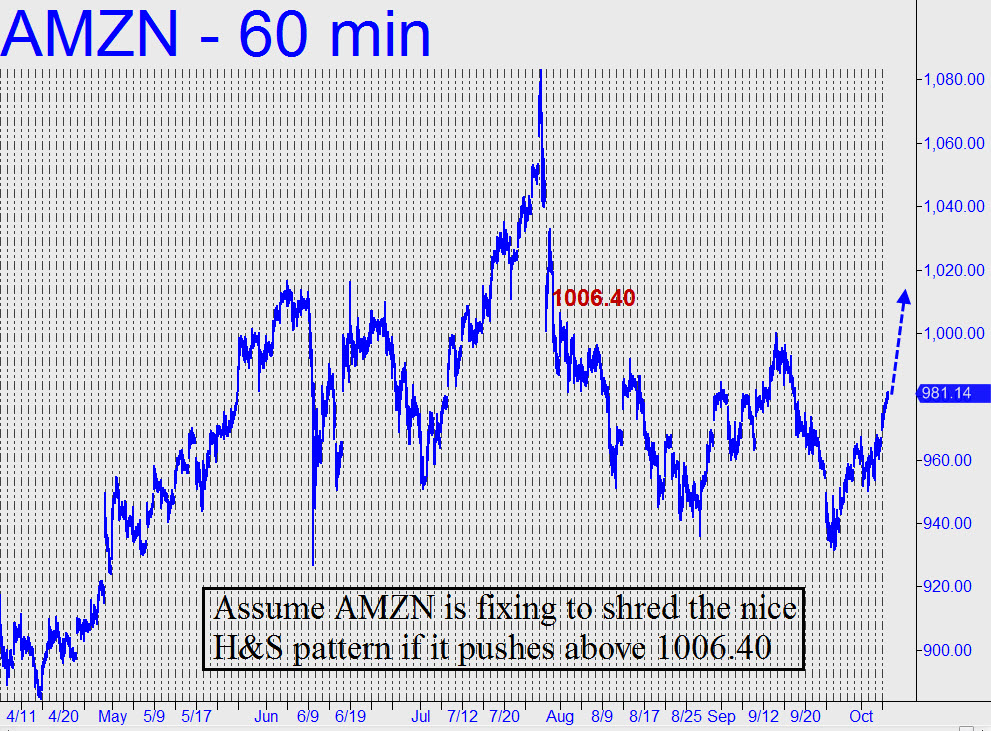
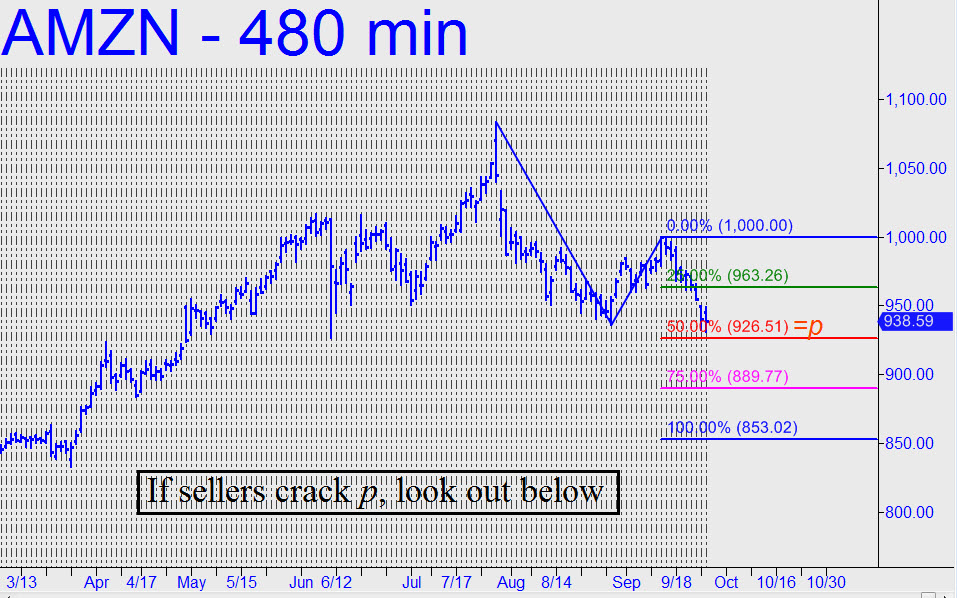
 AMZN is currently trading 186 points, or 13%, beneath the 1083.31 record high that I had projected to-the-penny before the stock first cracked 1000 on the way up. Since then, traders have been erecting a head-and-shoulders pattern that even I, ever skeptical of patterns that one can find everywhere one chooses to look for them, would have to concede is a real looker. A drop off its right edge could be expected to send AMZN into the $750-$850 range. At that point it’ll be interesting to see what kind of garbage DaBoyz rotate their seemingly infinite supply of Other People’s Money into. Somehow, one suspects, they’ll never lack for places to blow bubbles. Even so, a continuation of the bull market is difficult to foresee with AMZN, possibly joined by AAPL, in the dumpster. Since we don’t want to be constrained or disadvantaged by the vagueness of H&S targets, let me offer one at 853.02 if the stock trashes the midpoint support at 926.51 (see inset). As always, precise interplay with the higher number for a few days or longer would confirm the pattern itself and its target. _______ UPDATE (Sep 28, 12:01 a.m.): AMZN has taken a promising leap from p=926.51 (click here for chart), a perfectly logical spot for a major reversal if bulls are going to turn things around in a serious way. Odds of this happening will shorten if and when the rally starts surpassing prior peaks on the hourly chart. The closest lies at 973.40. Let’s set a screen alert there and for now just watch. _______ UPDATE (Oct 5, 7:37 p.m.): Okay, buyers have pushed past a few easy peaks. Let’s raise the bar now so that we don’t mistake a bear rally for the real McCoy. Specifically, I’ll suggest setting a screen alert just above the 1006.40 ‘external’ peak shown. If the stock can hurdle it that would imply the big head-and-shoulders pattern that has transfixed so many traders is about to get stretched beyond any semblance to the textbook version.