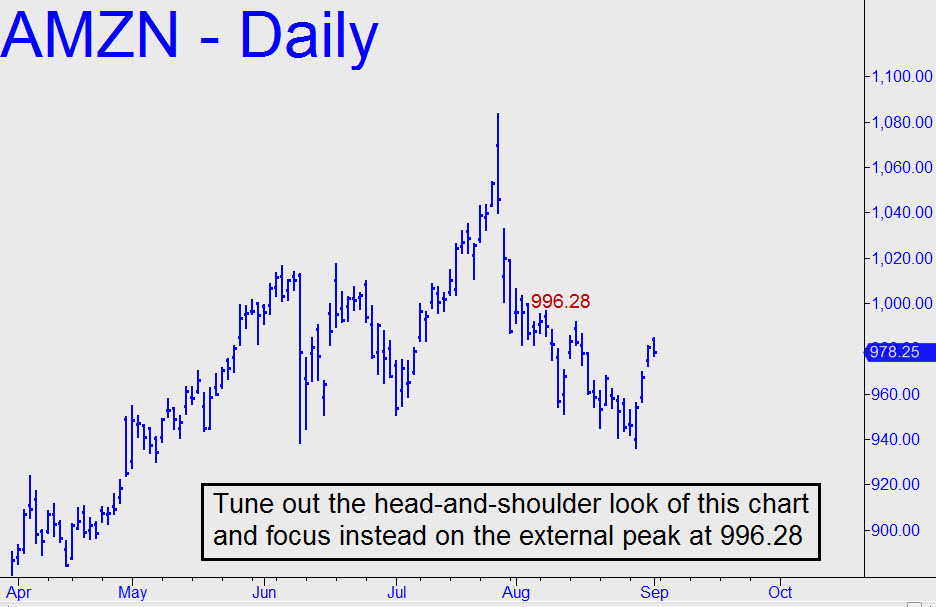
 In bull markets, stocks typically recoup steep declines with equally steep rallies. It is therefore troubling that AMZN has yet to recover after plummeting 147 points, or about 13.5%, following its record-high print at 1083.31 on July 27. The stock is a crucial bellwether for the bull market, and if it has topped for the long-term cycle begun in March 2009, then so have the broad averages. In the chart shown, AMZN has traced out what looks like a head-and-shoulders pattern. In fact, this one doesn’t conform closely enough to the classic textbook pattern described by Edwards & Magee to be worthy of our attention. Still, regardless of what you call it, there is nothing bullish about the pattern. Looking at it from a Hidden Pivot perspective, a bullish interpretation requires one to believe the stock is on its way to at least 1186. Maybe, but I doubt it. Rather than worry about it, let us stipulate that AMZN exceed the 996.28 ‘external’ peak that I’ve labeled before we infer that bulls are once again in command.
