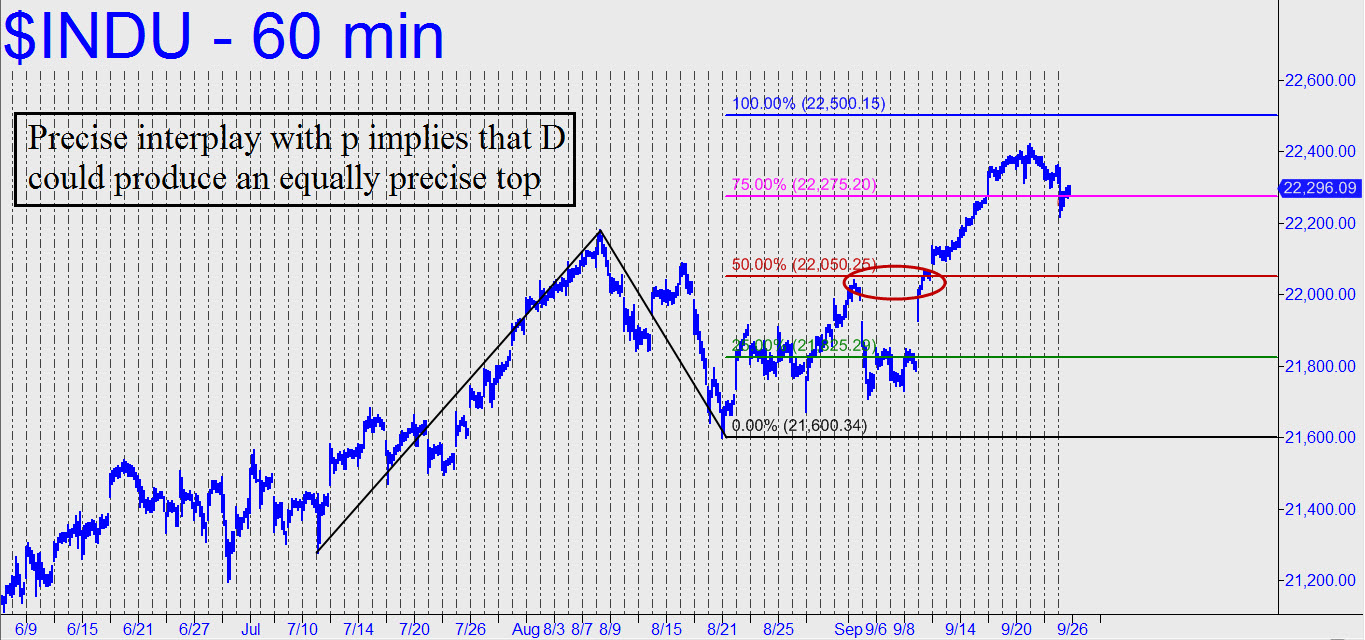
 It’s been a while since I looked at the Dow, but there’s no mistaking the 22,500 rally target, an important Hidden Pivot that lies a tad more than 200 points above. It should produce a precisely tradeable top when it’s hit, given the bull market’s intimate dance on two separate occasions with the 22,050 midpoint resistance (p) shown here as a red line. Moreover, when buyers finally blew past the line with a decisive leap on 9/11, they signaled their ability to push this gas-bag all the way to D=22,500. In the meantime, the best buying opportunity I could foresee would take place at the ‘p’ midpoint support of the small, still-developing downtrending abc pattern shown at the rightmost edge of the chart._______ UPDATE (Sep 26, 4:53 p.m.): Today’s action was bullish but unimpressively so, since all the very fleeting rally accomplished was to notch a new impulse leg on the lesser intraday charts. Wake me on Wednesday if anything happens. _______ UPDATE (Sep 28, 12:04 a.m.): The Indoos have been consolidating above a secondary pivot at 22,275 (click here for chart), suggesting that the 22500 target noted above is all but guaranteed to be hit. I strongly doubt it will be exceeded on the first try, however, so traders should plan on getting short there, perhaps using DIA put options. The Dow is on a mechanical buy signal at the moment, though, and if you are long for the move to 22500 as you should be, you can use some of your profits to cushion the stop when you go short.