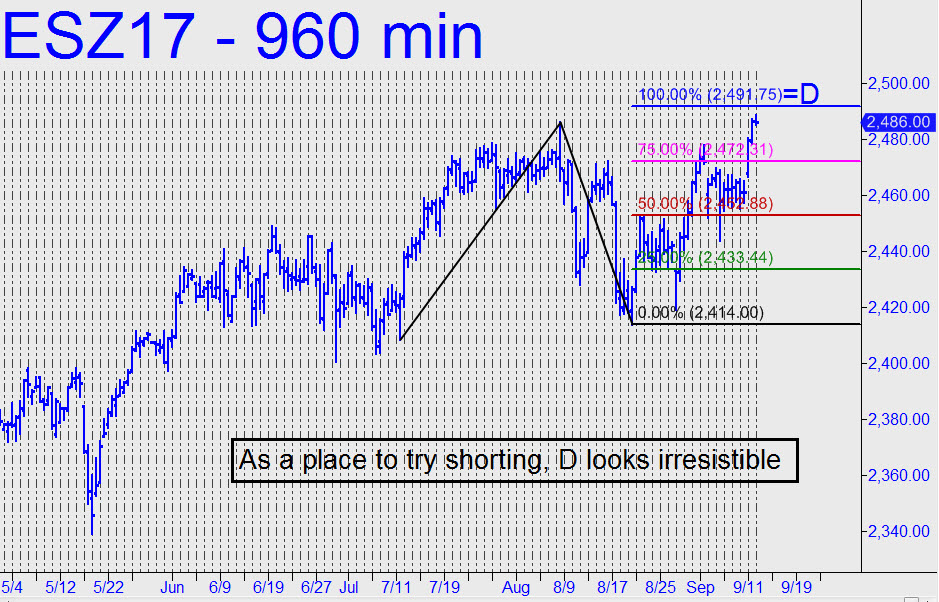
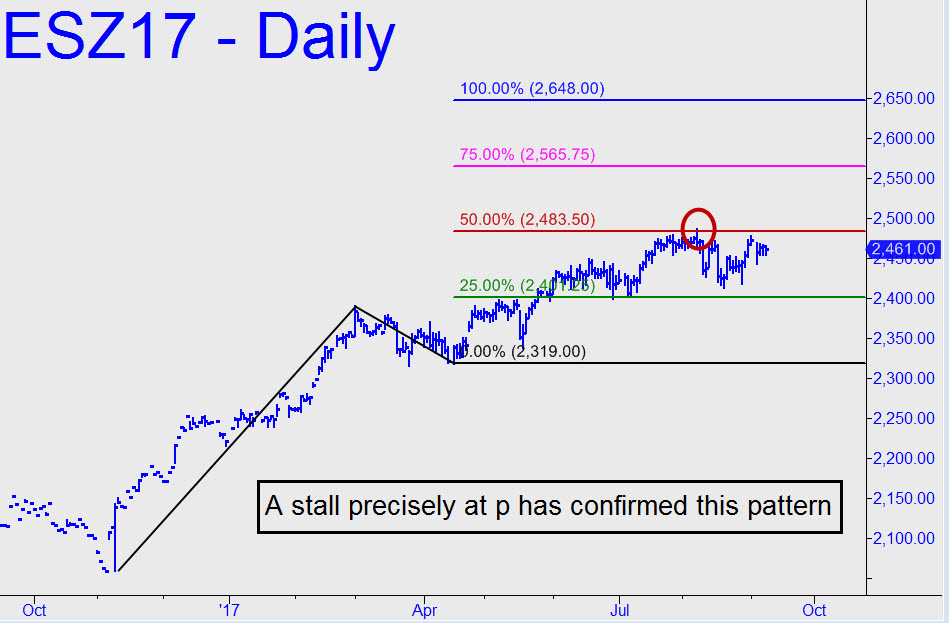
 The chart shown was selected for its menacing look. Because my gut feeling is that the bull market is ending, or perhaps already has ended, it behooves me to produce a chart that makes the point technically. This one does, very persuasively, with a stall almost precisely a p that would be entirely logical for a bull trend in its death rattle. Keep in mind that, using the September contract, we nailed the August 8 all-time high within a point to begin with. This chart simply updates the target, but with more evidence that p has in fact proven to be crucial resistance. It’s a big stretch to imagine that the chart will be resolved in bulls’ favor, since that would require a massive thrust toward 2648.00. It’s far easier for me to believe that the bull market begun in March 2009 is dying here, at these levels. Accordingly, I’ll recommend shorting two contracts at 2473.00, stop 2474.25, day order. That’s the midpoint pivot of a pattern on the daily chart starting with A=2419.25 on 8/29. ________ UPDATE (Sep 9, 10:01 p.m. EDT): The trade got stopped out for a $125 loss. Let’s try again, this time with an offer to short a single contract at 2491.75, stop 2492.75. This one’s just for fun, since I can’t resist the look of the 2491.75 target. Click here to see it in its full glory.