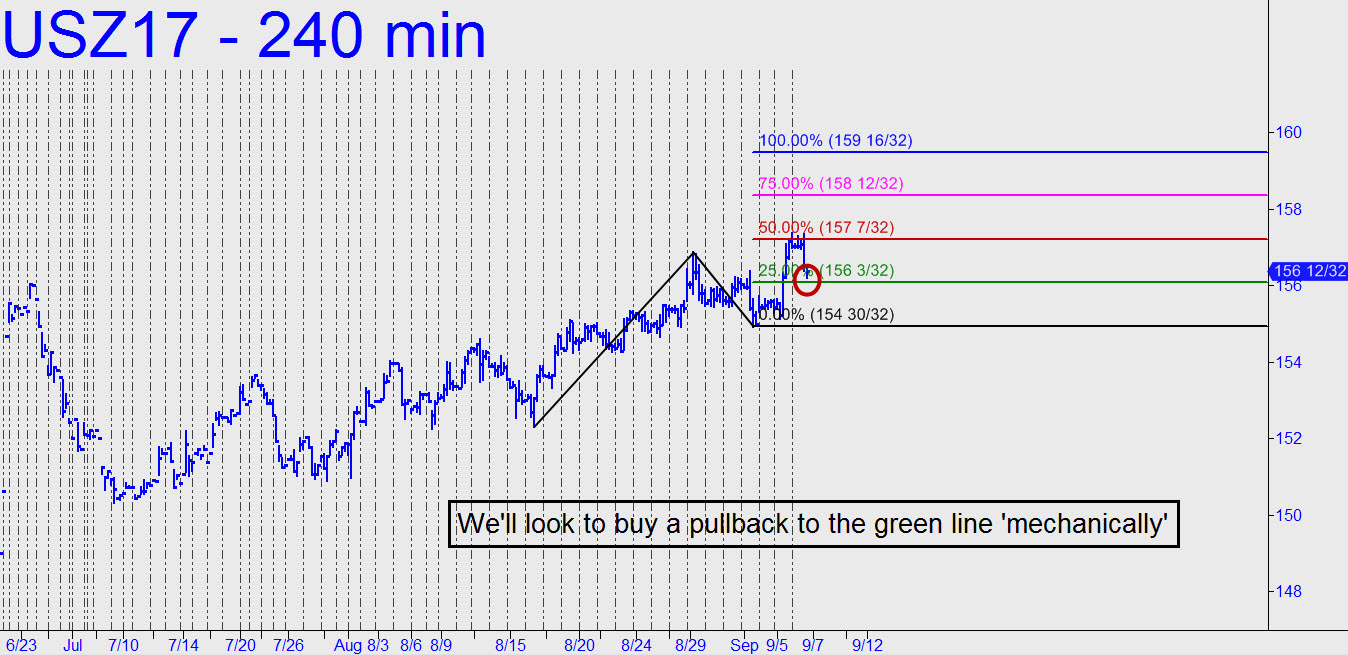
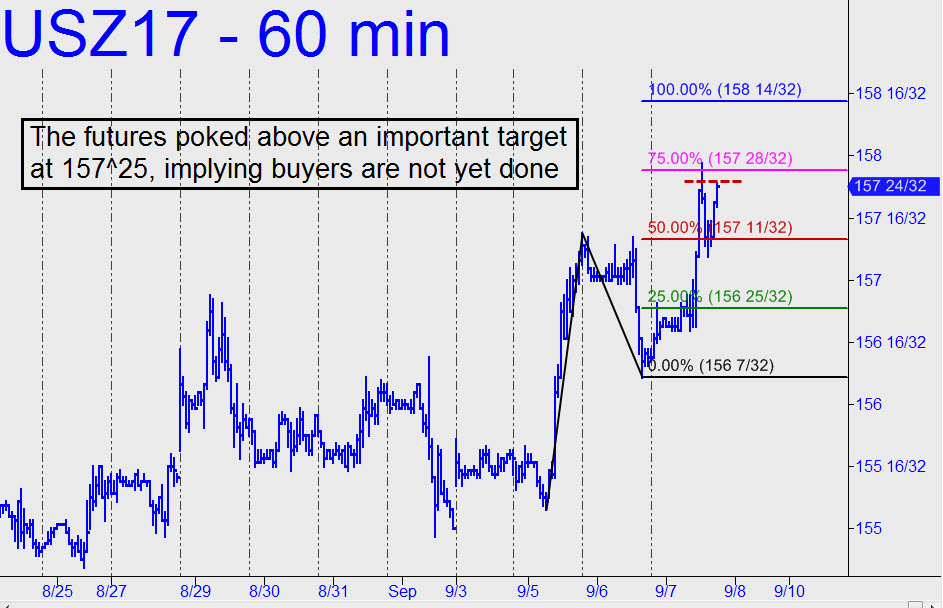
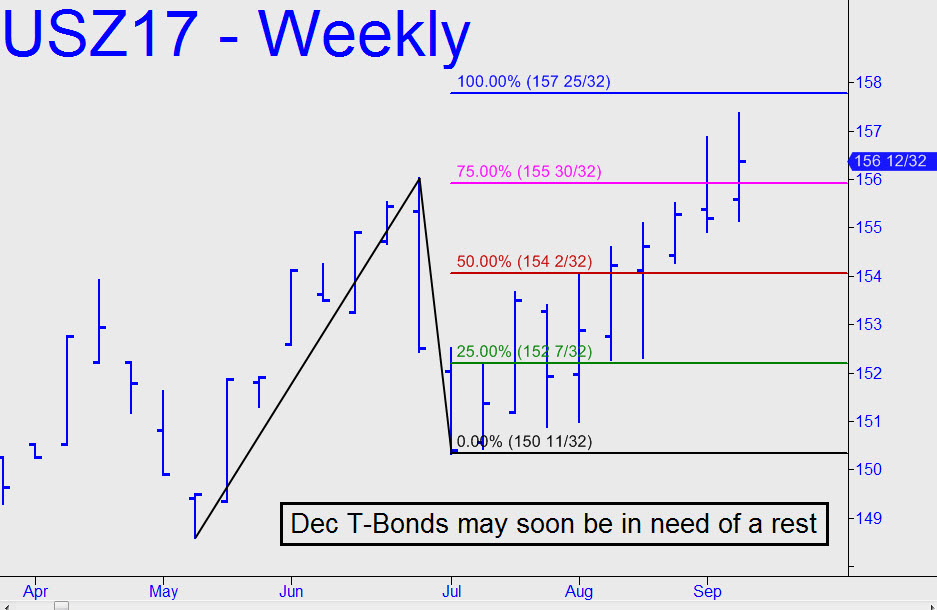
 T-Bond futures have had quite a run-up since early July, but they may need to rest for a week or two before embarking on another significant bull leg. In any event, we should remain open to the possibility that the recent high at 157^12 will mark a top of at least short-term importance. The initial upward penetration in August of the red line, a midpoint Hidden Pivot resistance at 154^02, was not sufficiently dramatic to make a finishing stroke to 157^25 a foregone conclusion. That said, the rally since then has had a steep enough pitch to make such a leap no worse than an even-odds bet. The actual bet I will suggest, however, is a ‘mechanical’ bid for a single contract at 156^03, stop 154^29. It is based on the very appealing ABC rally pattern shown. This is far more than we typically risk on a trade — about $1200 initially — but in this case the pattern looks too promising to pass up or to complicate with a ‘camouflage’ entry strategy. Even so, I will try to provide this via an intraday alert if the opportunity should arise. Under the best of circumstances, I would expect the ‘mechanical’ trade to take at least a week to get airborne, assuming it does. _______ UPDATE (Sep 7, 12:31 p.m. EDT): The futures spiked to a so-far high at 157^30 that slightly exceeded the target provided above, although not by enough for us to infer that more upside over the near term is certain. In the meantime, our bottom-fishing trade failed to trigger because the thrust came off a 156^07 low that lay four ticks above our bid. I expect the futures to pull back now, possibly significantly, but we should remain open to the possibility the rally will continue.________ UPDATE (5:31 p.m.): The intraday high at 157^30 exceeded my target by a technically not-very-significant five ticks, but the futures looked like the wanted to take another leg up at the final bell. If so, use the 158^14 Hidden Pivot resistance shown as a minimum upside projection. As always, if the rally exceeds the target, it would be indicating still more upside to come. _______ UPDATE (Sep 10, 6:30 p.m.): Friday’s surge narrowly missed the target, subsequently generating a bearish impulse leg on the hourly chart. A pullback to 156^25 would trip a ‘mechanical’ buy signal, stop 156^06, but I’d suggest using it only if you are comfortable converting it to a ‘camouflage’ set-up on the three-minute chart. Please report any fills in the chat room so that I can decide whether to establish a tracking position.