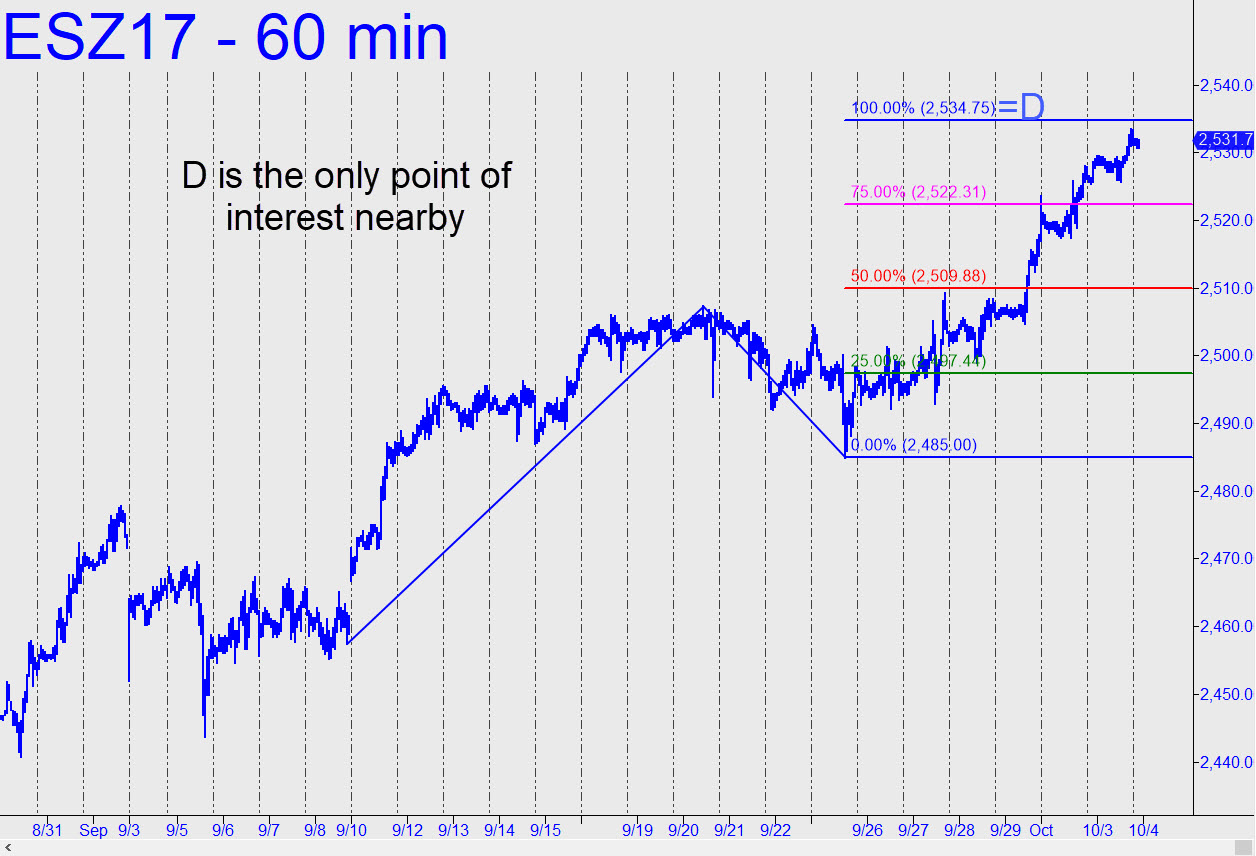
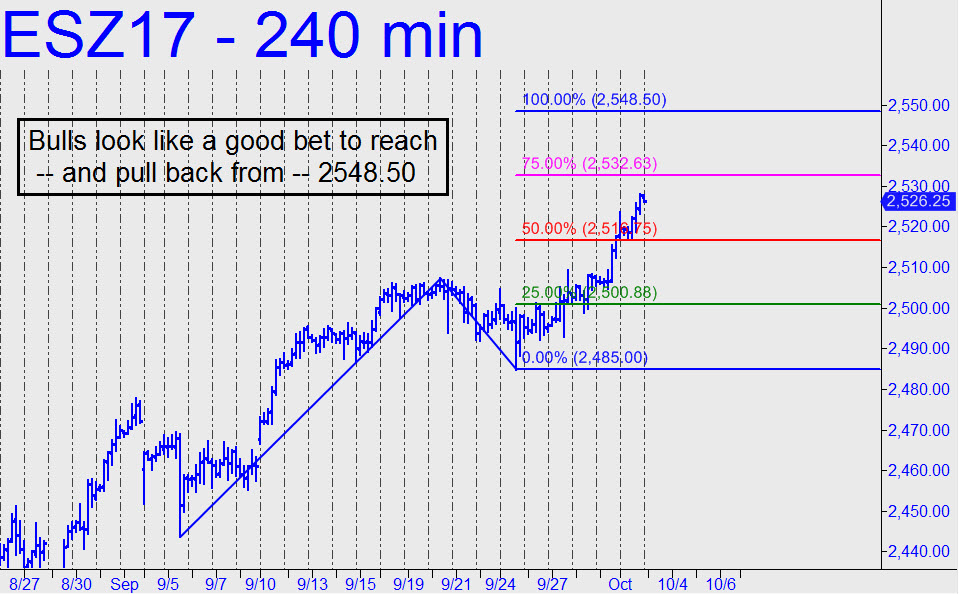
 The pattern shown suggests an easy move ahead to at least 2548.50, and I’ll recommend trading this vehicle with a bullish bias until such time as the target is reached. A pullback to the red line, a Hidden Pivot midpoint, would generate a ‘mechanical’ buying opportunity that would require a stop-loss at 2506.00. Since the approximately $500 entry risk is more than we typically abide, I’ll further suggest — if you know what you’re doing — that you ‘convert’ the mechanical entry signal into a ‘camouflage’ trigger by executing the trade on a chart of much smaller degree (i.e., the one- or three-minute.) Stay tuned to the chat room for further guidance if the trade sets up as I’ve detailed and you’re uncertain how to proceed. Alternatively, if ES should fall to the green line in the first half of Tuesday’s session, you can do the ‘mechanical’ trade straightforwardly with a 2500.75 bid, stop 2484.75._______ UPDATE (Oct 3, 9:40 p.m.): There was no gracious pause Tuesday to accommodate stragglers, suggesting the lazy man’s approach will not get us aboard. (Very) short-term, the only spot that looks interesting to me is the 2534.75 target of the pattern shown. Rather than shorting it, I’ll suggest spectating, since the ease (or lack of it) with which buyers push past it can tell us how much trend strength is percolating beneath the surface._______ UPDATE (Oct 4, 6:03): The 2534.75 pivot gave way easily as the futures ascended to an intraday high at 2538.00. They went on to close above the resistance, leaving little doubt that still higher prices are coming. I expect the 2548.50 pivot noted above to cap the rally briefly and produce a tradable pullback, but we should always be ready for more upside without pause. If it comes, there’s a daunting HP at 2561.25 that was flagged here earlier. Save some ammo to get short there if it’s reached, since it looks VERY promising to me. On the daily chart, here are the coordinates: A=2339.00 on 5/18; B=2486.25 on 8/8.