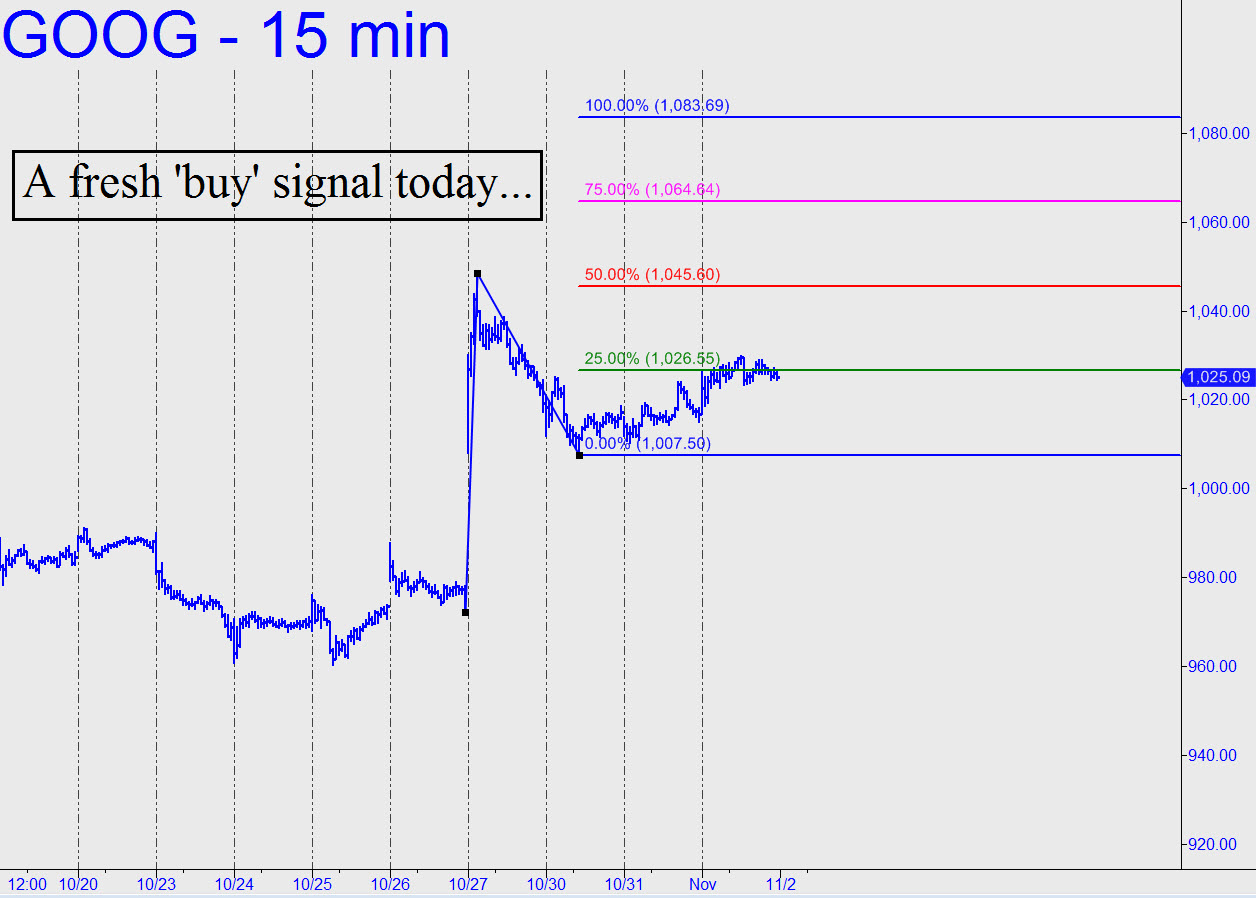
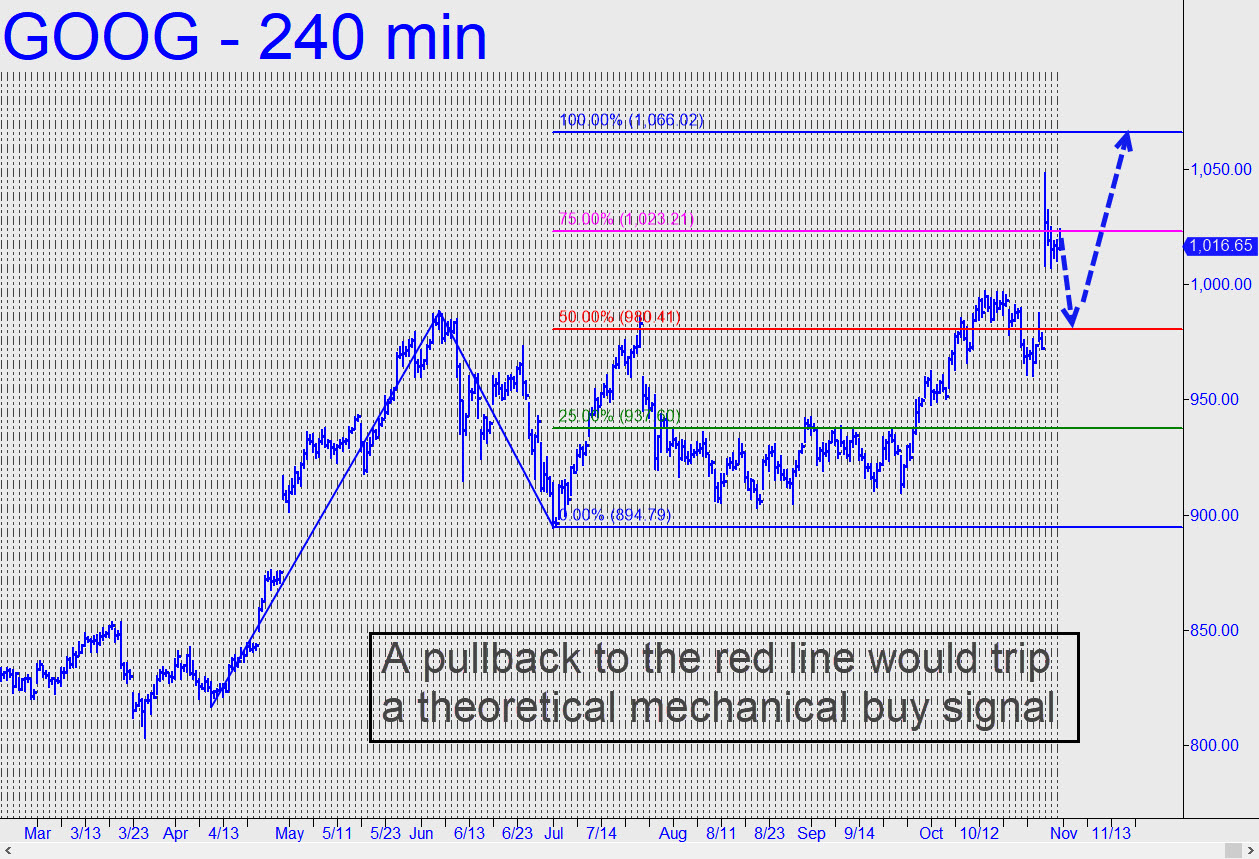
 The chart puts in timely perspective the 1066.02 target we’ve been using to stay comfortably on the right side of GOOG’s steepening bullish trajectory. The stock could pull all the way back to the green line without doing any technical damage to the intraday charts, but I doubt the correction will go that far. For now, we’ll plan on using a ‘mechanical’ tripwire at the red line to initiate a long position. The implied stop-loss on a straight ‘mechanical’ bid there would be at 951.87, but it may be more advantageous to use an alternative entry strategy such as ‘camouflage’ if and when the time comes. Stay tuned to the chat room for further guidance in real time. ______ UPDATE (Nov 1, 9:20 p.m.): Odds of a pullback to the red line mentioned above are not encouraging, especially since GOOG tripped a theoretical ‘buy’ signal today at 1029.47 that has put a 1083.69 target nominally in play (click here for chart).. We’ll let it pass, but if you’re more ambitious, I’ll suggest using the 15-minute chart to craft a ‘camouflage’ entry set-up.