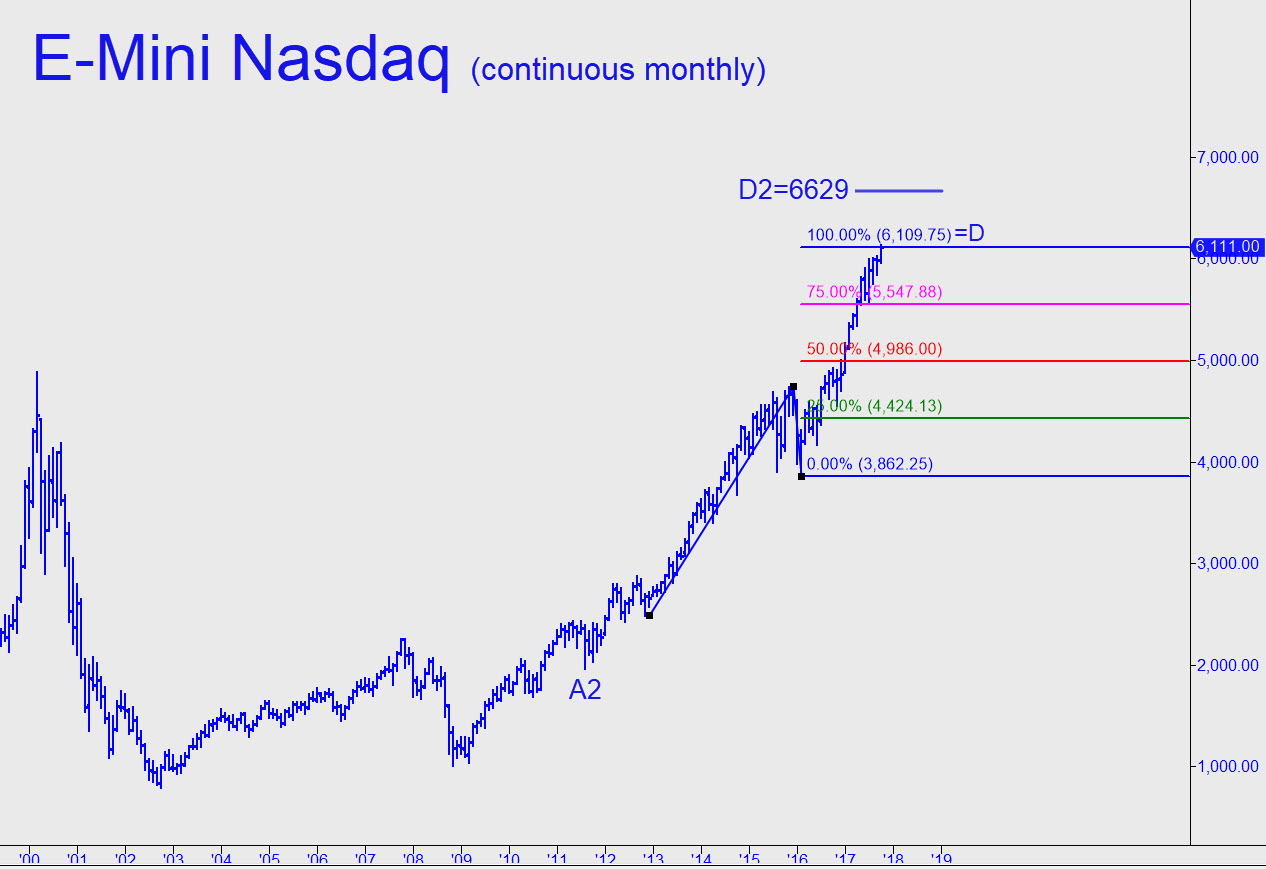
 The chart shown is a composite, over many years, of different contract months, so we shouldn’t rely too heavily on the 6109 target to show precise stopping power. However, it should work well enough to give us a good read on trend strength. Specifically, if the futures close for two consecutive MONTHS (not days, as originally written) above 6109, or trade more than a HUNDRED points (not fifteen, as originally stated) points above it intraday, I’d suggesting using a new target at 6629.50 as a minimum upside objective. It is calculated by sliding the point ‘A’ low down to the next distinctive low, which I’ve labeled A2.
