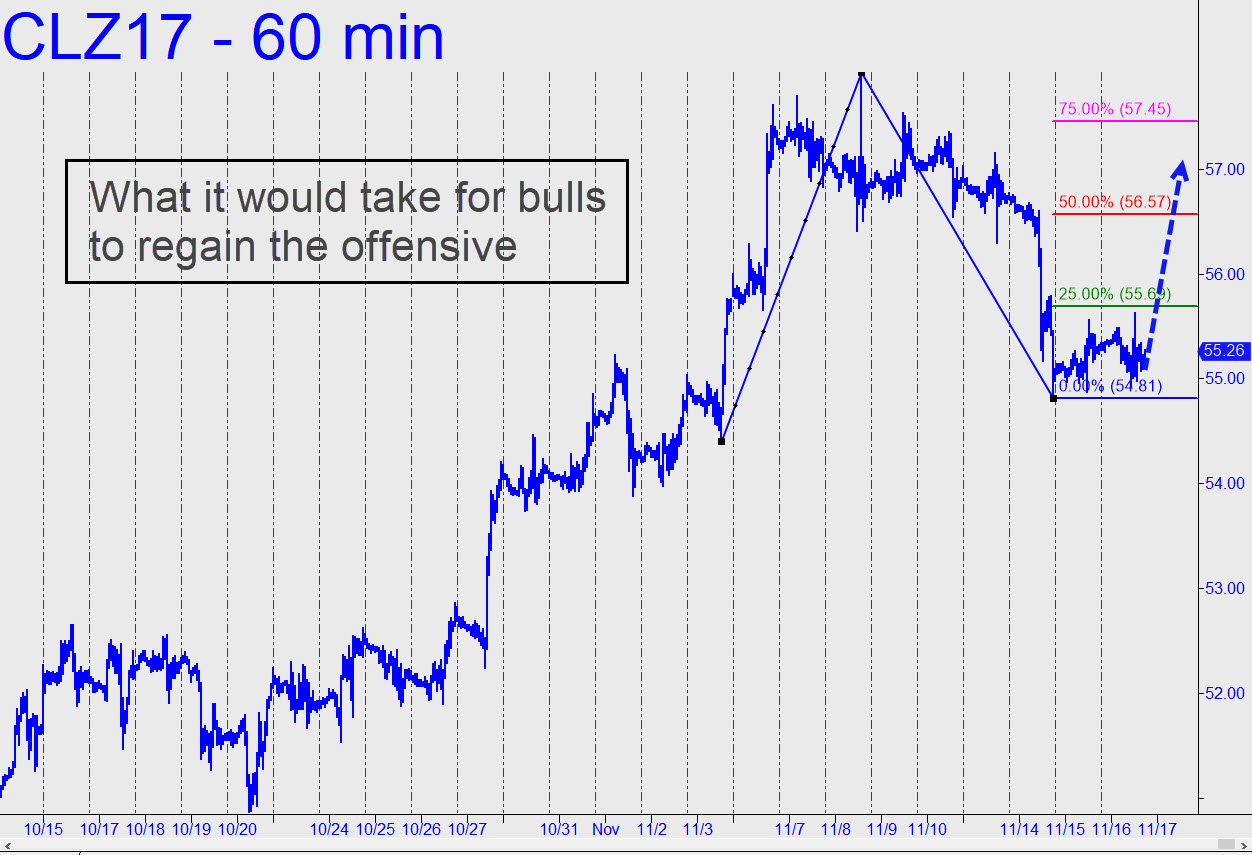
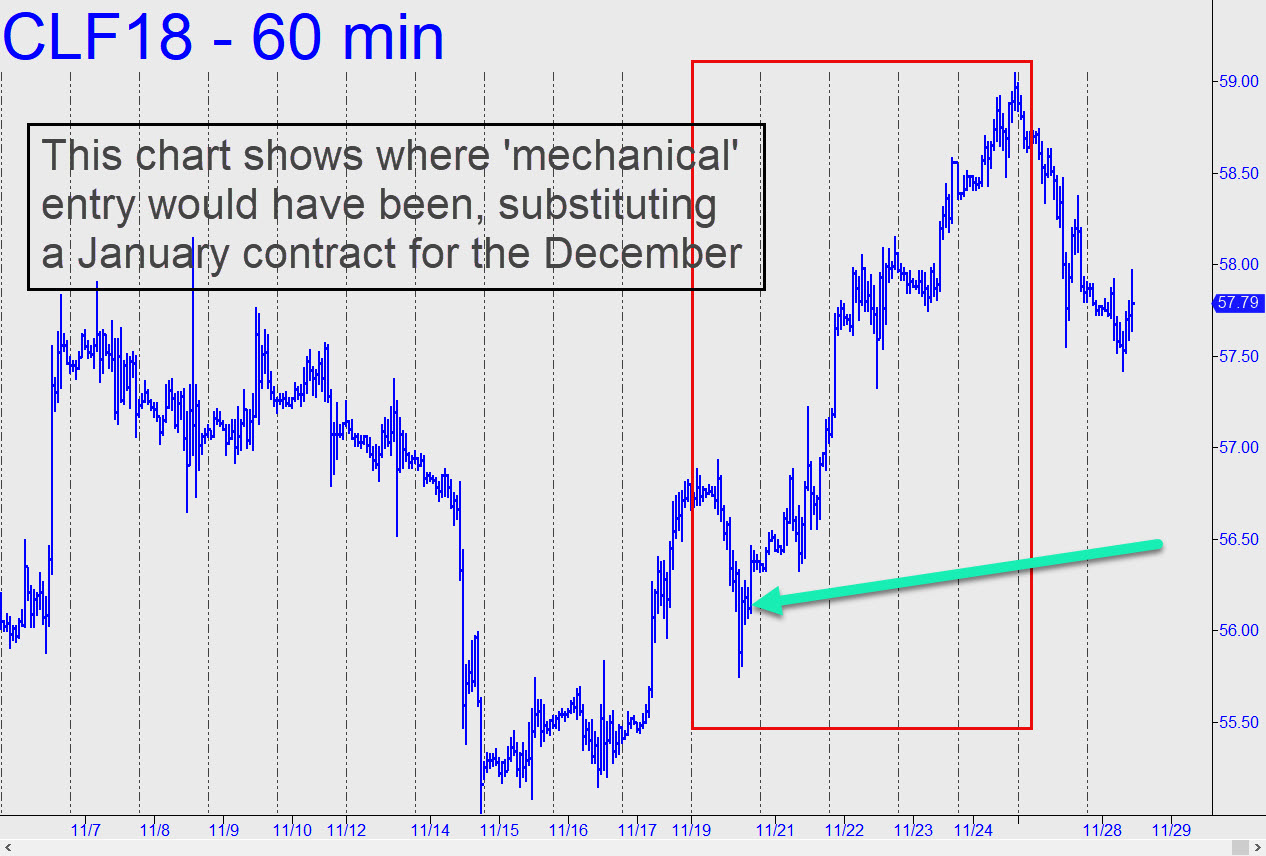
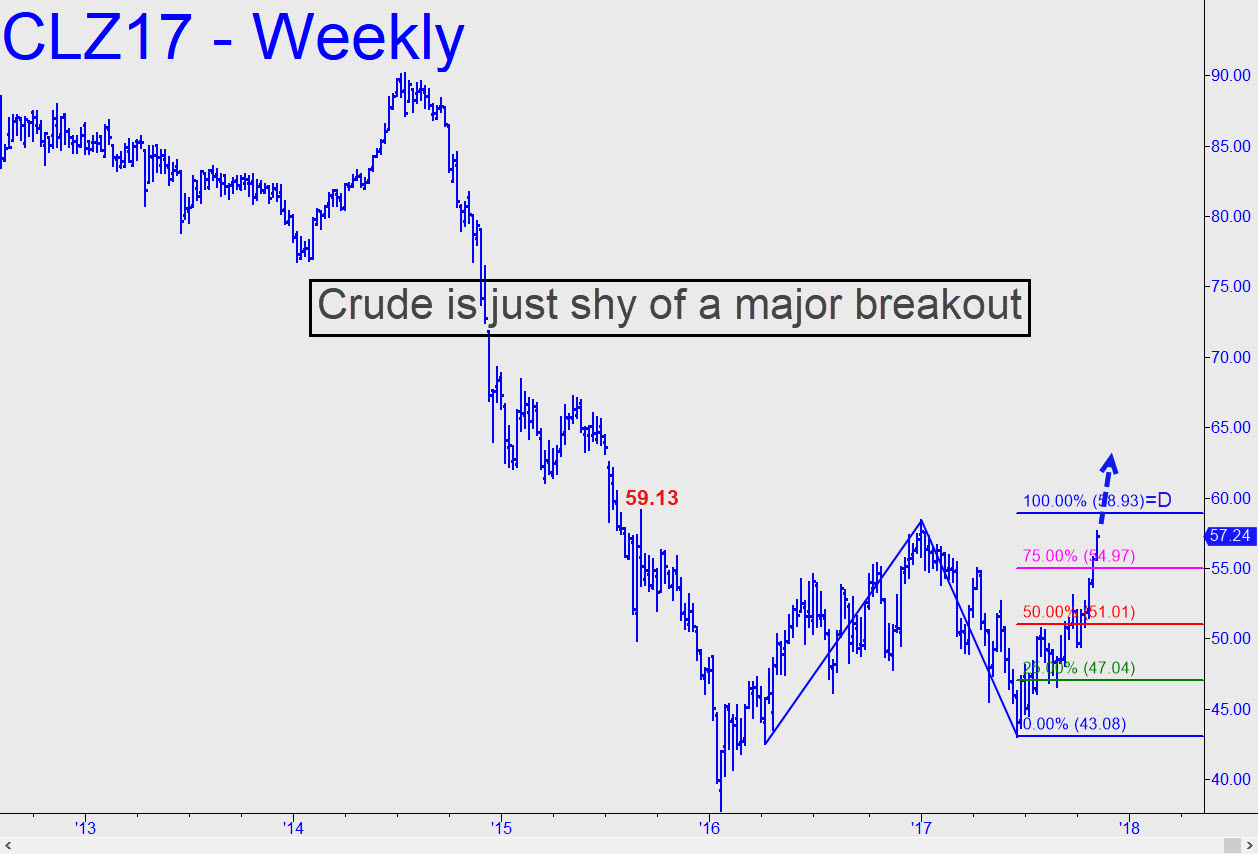
 December Crude has shredded its way higher in recent weeks and is close to generating a powerful impulse leg on the weekly chart. That would occur on an upthrust exceeding the two labeled peaks, the higher of which lies at 59.13. Although my long-term outlook for this vehicle has been bearish, I would have to put it on ice, presumably for a long while, if the nearly-vertical rally begun in mid-October breaches the 59.13 peak. The closest Hidden Pivot, 58.93, lies just a tad shy of our uber-bullish threshold, but it’s hard to imagine the futures getting there without going the extra couple of inches that it would take for a breakout. Thereupon, my immediate objective would be 63.79. a Hidden Pivot off the weekly chart (A=37.33 on 1/22/16). _______ UPDATE (Nov 16, 5:33 p.m. ET): Buyers would need to push the December contract above the 56.57 midpoint resistance to go back on the offensive._______ UPDATE (Nov 19, 6:30 p.m.): Friday’s spirited rally slightly exceeded the midpoint resistance noted above, shortening the odds of a follow-through to the pattern’s 58.33 target. A close above the p resistance at 56.47 on Monday would likely clinch this, but we’ll wait for it to happen before we draw any conclusions. _______ UPDATE (Nov 27, 9:45 p.m.): The pullback to 55.69 today tripped a mechanical ‘buy’ signal at that price, stop 54.80. If you lack the confidence to pull the trigger on mechanical trades, especially trades with substantial entry risk (in this case $890 per contract), I’d suggest following this gambit to its conclusion. _______UPDATE (Nov 28, 9:45 a.m.): My apologies for the confusion, since the December contract stopped trading around the time the mechanical buy signal noted in that last update was triggered. However, here is a chart that shows how the trade would have played out if the January 2018 contract (CLF18) had been substituted. As you can see, the bull trade paid off straightaway with a $3 rally from the green line that would have made for a very profitable and low-stress ride.