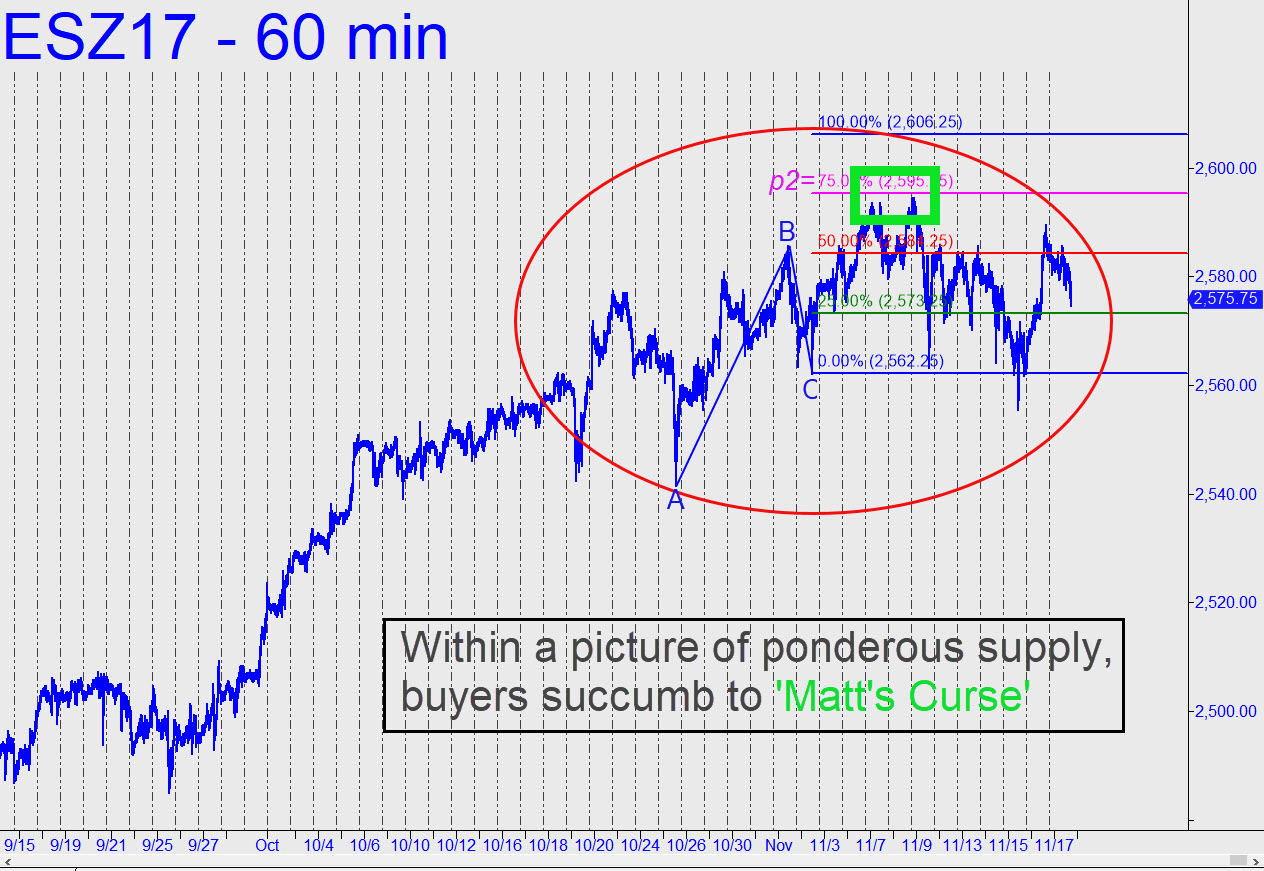
 The suffocating weight of supply has become visually obvious in the hourly chart (click on inset). Are the S&Ps forming an important top? Odds are at least somewhat against it, given that the bull market has been chugging blithely along for 104 months. But there is no getting around the fact that bulls have been challenged to make headway for the last month or so. Moreover, they are certain to have difficulty keeping stocks levitated while investors await Q4 earnings in January that will have to top Q3’s sensational results. From a Hidden Pivot perspective, the incipient weakness now in evidence could turn lethal if downtrending abc corrections start exceeding their midpoints pivots — or even more bearishly, their ‘d’ targets. So far this hasn’t happened. But we shouldn’t be surprised if it does, and soon, since uptrending ABC patterns are having increasing trouble reaching their ‘D’ targets. This is also shown in the chart. Notice that a recent rally almost precisely to p2=2595.25 fulfilled ‘Matt’s Curse’ by reversing well shy of the ‘D’ target to take out the point ‘C’ low of the bullish pattern. This is a shot across the bow as far as I’m concerned, warning us to be acutely alert to any further signs of weakness, starting with dominant and corrective patterns on the sub-hourly charts._______ UPDATE (Nov 21, 12:18 p.m.): Posted in the chat room at 9:03 a.m.): I’d suggest using this pattern on ’60’ to trade a 2608.25 target: A=2546.25 (10/25); B= 2594.50 (11/8); C= 2555.50. It signaled a mechanical buy yesterday at x=2568.69 that has produced an $1100 profit/contract so far. A pullback to p=2581.88 would offer a second chance to get long.
