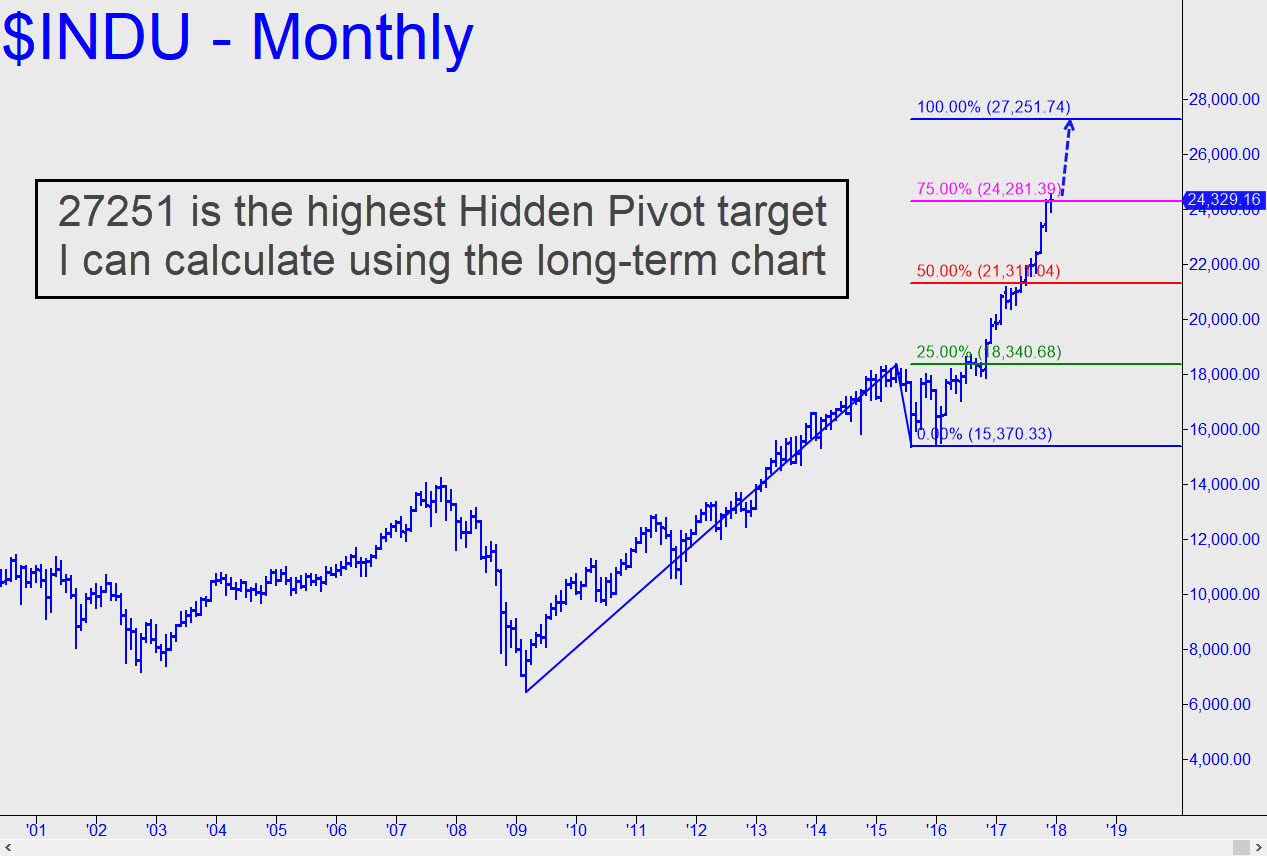
 We’ve been using a Hidden Pivot resistance at 25113 as a bull-market target, but it’s time to raise our sights to 27,251, the highest objective that can be calculated using the long-term chart. The pattern itself is like nothing I have ever seen before, with an extraordinarily long impulse leg that saw only one significant correction between 2009 and 2015. The fact that so powerful a rally could give way to a second (C-D) stage even steeper and with fewer corrections is strongly suggestive of a blow-off. If that is what we are in fact witnessing, the 27251 target should put us in excellent shape to trade the implied, huge rally, but also to reverse polarity and get short at the exact top. As always, you should stay tuned to the chat room and/or check ‘Email Notifications’ on your account dashboard if you want to stay closely apprised of trading opportunities that develop in real time. _______ UPDATE (Dec 17, 9:38 p.m.): Be alert to the possibility of a fall below 24,499. That would be the first hint of trouble on the hourly chart. _______ UPDATE (Dec 19, 8:15 p.m.): Raise the hint-of-trouble threshold to 24682 — not that such a concern is even remotely on the tiny endorphin-addled brains of those responsible for the current 24754. ______ UPDATE (Dec 21, 5:30 p.m.): The new “trouble” threshold is 24617.
