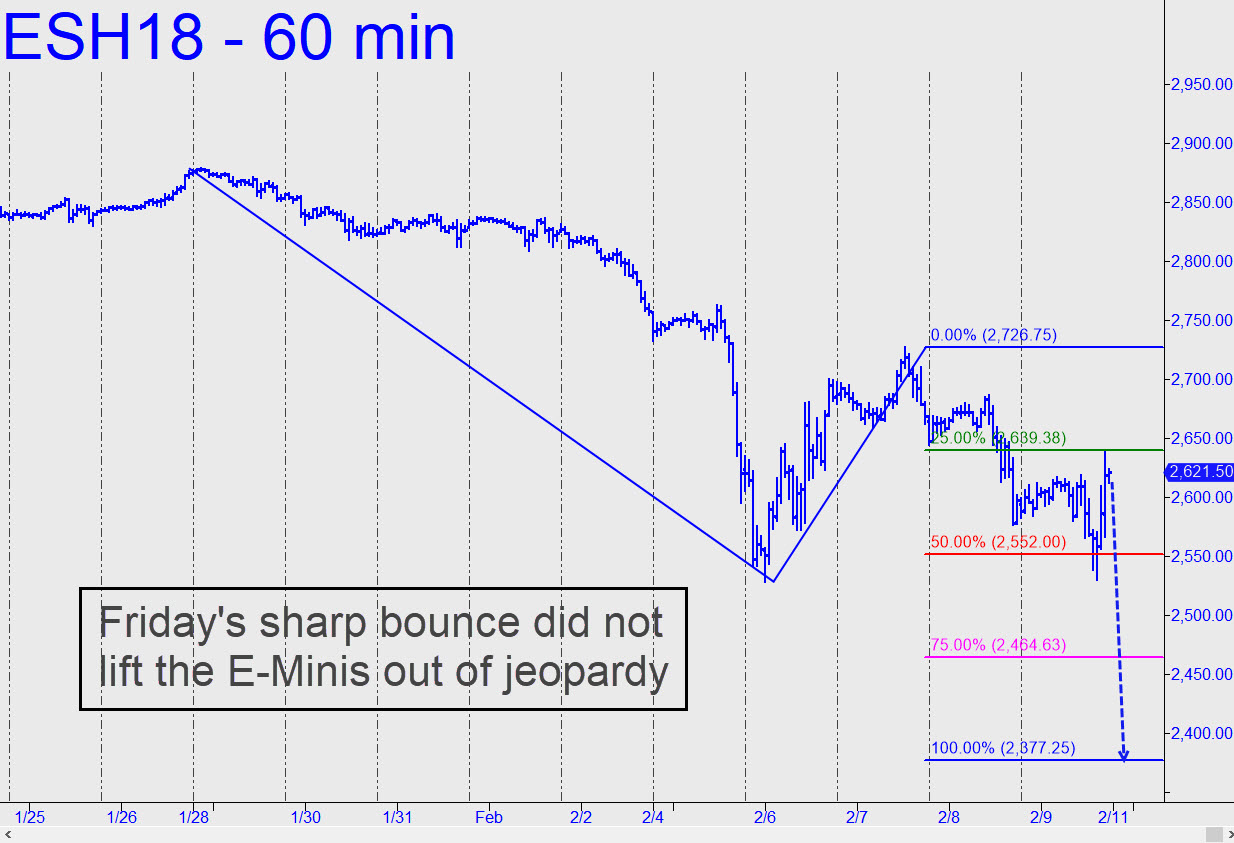
 Friday’s bounce seemed impressive. However, from a technical standpoint it reminded me of the movie hero who has taken a bullet through the middle of his chest but still manages to sprint to his girlfriend’s open arms before dying. In this case the fatal bullet in the chest is the E-Mini S&P’s dip beneath the red line, a midpoint Hidden Pivot at 2552.00 that is key to interpreting the chart. Typically, when the midpoint support has been decisively exceeded as it has been here, it means the dominant trend is likely to continue to the next level. That would imply a fall to at least 2464.63, the pattern’s ‘secondary pivot’. That is what I currently expect, notwithstanding the fact that the March contract rebounded a spectacular 107 points Friday in under two hours. The chart knows nothing of the hubris and high-fives that swept Wall Street and the news media at the closing bell. I’ll put my money on the chart, though, stipulating that to negate my very bearish target, the futures would have to close for two consecutive days below the red line without having exceeded 2726.75. Even then I would be reluctant to sound the all-clear, but we’ll cross that bridge when we get to it.
