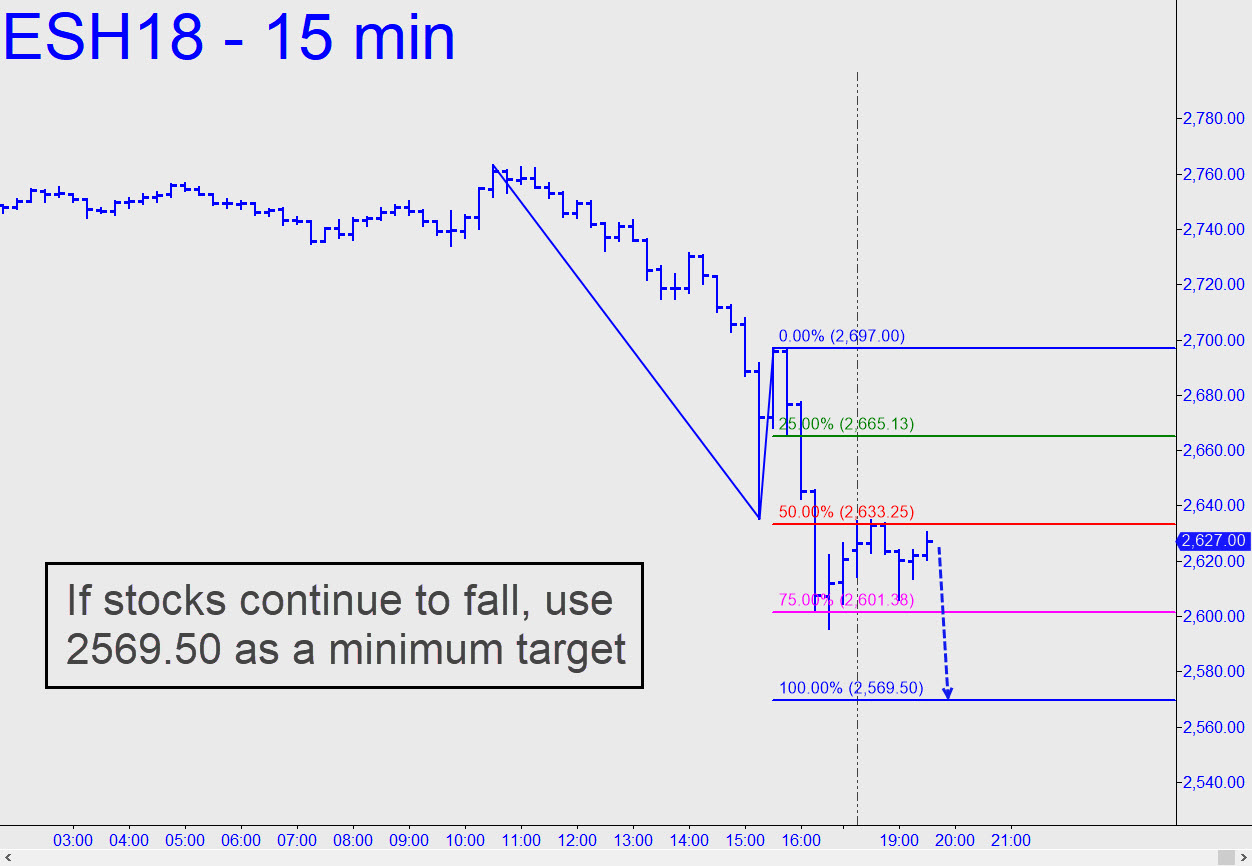
 The 2569.50 target shown can be used as a minimum downside target if stocks get hit again on Tuesday. It will remain valid as long as 2697.00 has not been exceeded to the upside. A second pattern that could be useful in determining an alternative low for this remarkable sell-off can be fashioned using the 2696.00 point ‘C’ of the pattern shown as the point ‘A’ high of a new, downtrending ABC. I have not done so, however, because the futures seemed likely to get short-squeezed higher Monday night, leaving point ‘C’ uncertain at the moment. If the futures go no higher than 2634.75, the resulting pattern would indicate slippage to at least 2584.00, with a worst-case destination of 2533.50. I will clarify this before Tuesday’s opening, depending on how high the futures have traded overnight. ______ UPDATE (Feb 6, 6:02 a.m. EST): The futures bottomed overnight at 2529.00, a few points beneath the target given above, before rallying a spectacular 115 points to a so-far high at 2644.50. They have since slipped back and are currently trading around 2621.00, but if they can decisively exceed the 2630.63 midpoint pivot shown they would become an odds-on bet to reach 2662.50. Click here for new chart.
