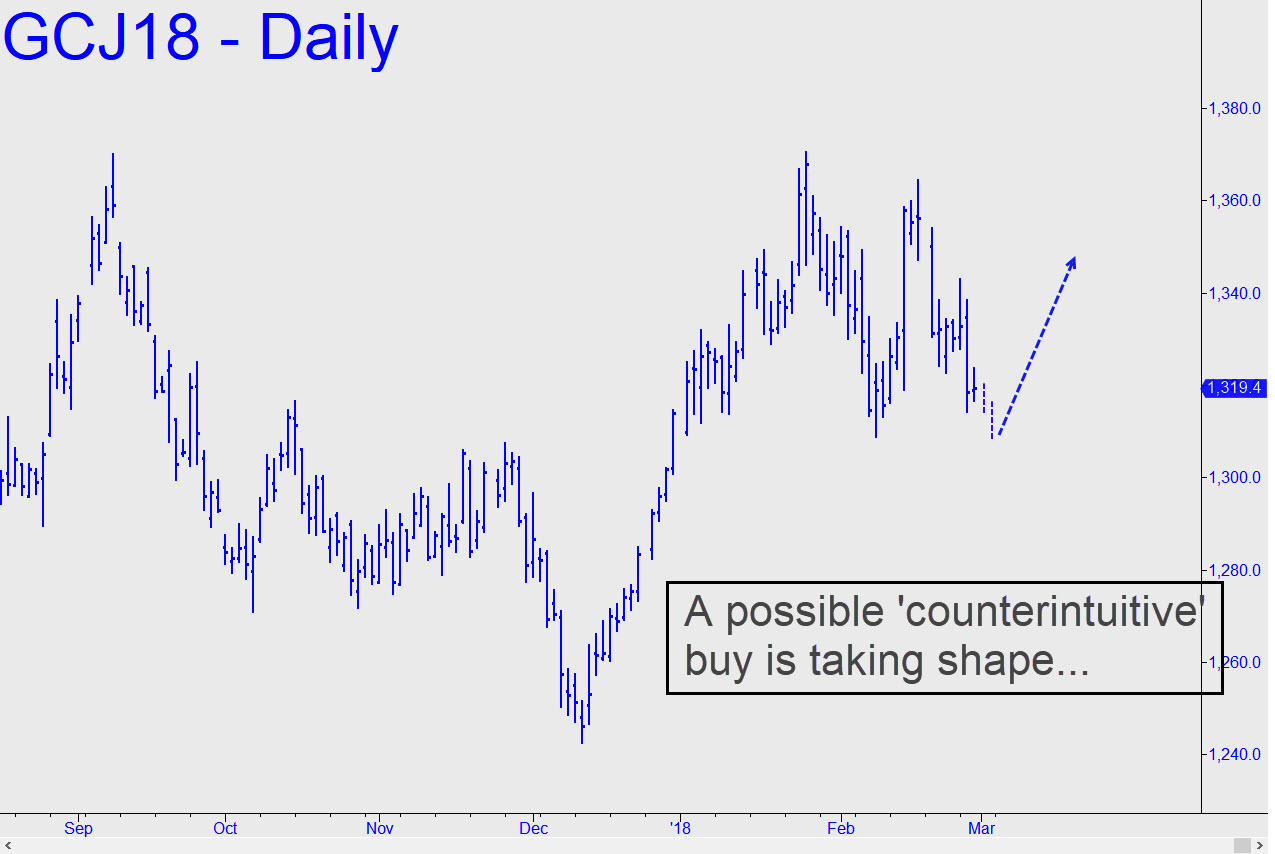
 Much as I’ve dissed gold in recent weeks, the chart shown is bullish for one reason: the January high at 1370.50 exceeded the peak made four months earlier by 50 cents. That’s not much, but it makes the entire rally from December’s 1242.70 low bullishly impulsive on the daily chart. It also implies that April Gold could fall a further $75 without negating the bullishness of the chart. But how do we get long without suffering the damage and disappointment bullion has been inflicting on true believers for so long? For starters, I’ll suggest focusing on the possible ‘counterintuitive’ set-up that is taking shape on this chart. A point ‘C’ low in the range 1307.20-1310.30 would look pretty tempting, and that is what I recommend you look for. I may not be in the chat room if it triggers, but just ask any Pivoteer for guidance if the trade sets up in the way I’ve noted. _______ UPDATE (Mar 1, 10:45p.m.): Gold popped today, but from a 1304.70 low just beneath the range I’d specified to trip a ‘counterintuitive’ buy signal. We can start looking for another way to get long above 1335.60, since that would activate a bullish pattern with upside potential to as high as 1431.40 (daily chart, A=1242.70 on 12/12/17).
