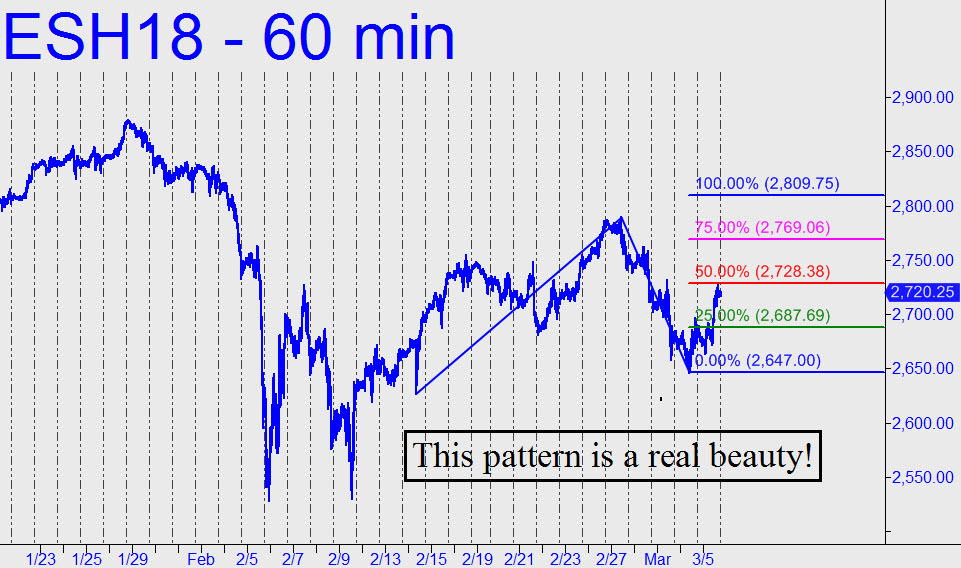
 The sinuous beauty of the pattern shown should make the E-Minis very predictable in the days ahead. Specifically, if the futures pop decisively above the red line, a midpoint Hidden Pivot at 2728.38; or better yet, close for two consecutive days above it, they would become a very strong bet to reach the 2809.75 target. Moreover, we could expect a pullback from within a point or two of that number — one that aggressive traders could use to get short with a stop-loss as tight as six ticks. The foregoing is based on Monday’s precise stall at the red line. Let’s see how it plays out. I will advise if any low-risk trade set-ups occur along the way. For now, be aware that a retracement to the green line (2687) would trip a ‘mechanical’ buy signal, stop 2646.75. I am not specifically recommending this tactic, however, because of the $2000-per-contract entry risk. Stay tuned to the chat room if the opportunity to substitute a low-risk alternative entry method such as ‘camouflage’ should arise. _______ UPDATE (March 6, 7:15): The futures have fallen somewhat beneath the 2687 threshold where’ I’d suggested that traders place a mechanical’ bid, stop 2646.75. In practice, I am still advising you to substitute a ‘camouflage’ entry set-up that would use an uptrending abc pattern on the 3- or 5-minute chart. This is the least risky way I can advise to get aboard, but it will require the diligent attention of, presumably, night owls. The buying pattern is a pretty good one, and that means if our ‘mechanical’ trade fails to produce a profit, we should grow more cautious toward stocks. Click here for the chart.
