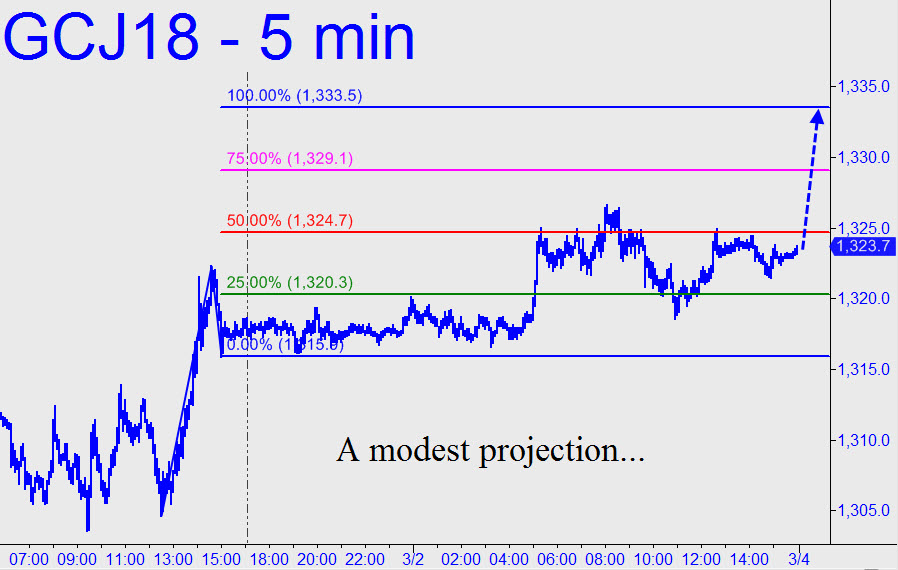
 Gold hasn’t earned an extravagant rally projection, so we’ll stick with the little stuff for the time being. I’d said we could look for bull trades if the April contract pushed above 1335.60, and that advice still obtains. However, the pattern shown would create a buying reason at a slightly lower threshold. Specifically, if the futures can push a point or so above the 1333.50 target, you can start looking for a ‘camouflage’ play on, say, the one-minute chart. Pivoteers, please take note: Based on this pattern, April Gold tripped a ‘mechanical’ buy signal on Friday when it dipped beneath the green line at 1320.30. Following the simple rules for this type of trade, subscribers would have cashed out half of a four-contract position at 1324.70 for a gain of nearly $900. _______ UPDATE March 6, 8:24 p.m. EST): April Gold performed slightly better than we’d asked of it. Now let’s see if it can achieve — and perhaps surpass — the 1367.50 midpoint pivot shown in this chart. This Hidden Pivot resistance can be used as a minimum upside objective for the near term. If the futures should reach or slightly exceed it and then pull back to the green line, that would trip a ‘mechanical’ buy signal, stop 1303.50. _______ UPDATE (March 8, 6:31 p.m.): For tonight’s assignment I will suggest reading a dozen or so Gold touts for various contract months that have been archived. This will give you a perspective on why, no matter how bullish my forecast is for a given day, my big-picture advice is to expect disappointment for the foreseeable future. DaBoyz are not taking gold significantly higher until they are good and ready. This will require a sea change in Wall Street’s status quo, which is to buy stocks, sell bonds, sell dollars and heedlessly lift a few lunatic stocks skyward to create a bull market on-the-cheap.
