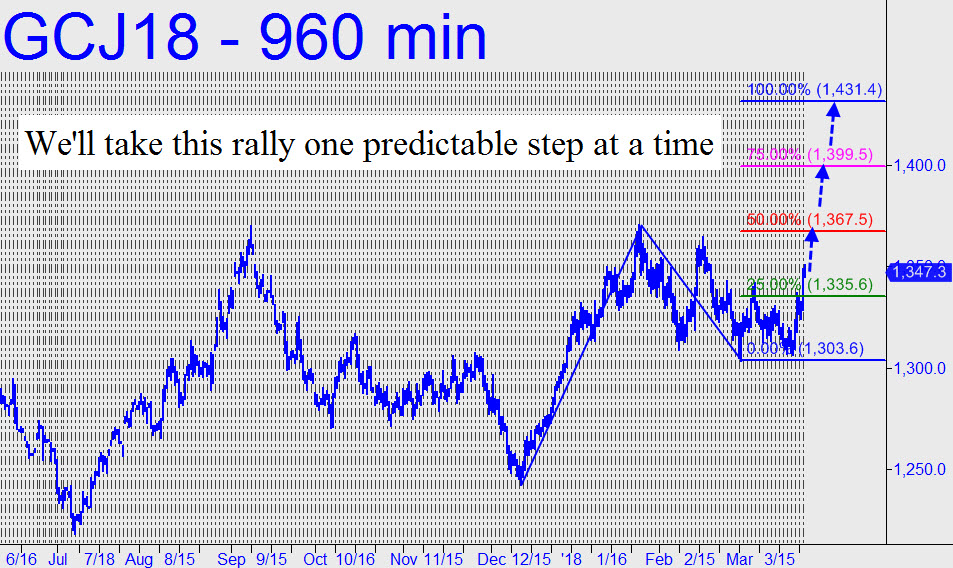
 As promised, I’ve adjusted my sights upward, now to the 1367.50 midpoint Hidden Pivot of the felicitous pattern shown. It’s tempting to put a move to D=1431.40 on our list of likelihoods, but my forecasts will be of greater value to you if I spell out bullish possibilities one easily predictable step at a time. Thus is the 1367.50 pivot a logical benchmark to use for a minimum upside target for the near term. This is particularly so because Friday’s surge exceeded two middling peaks: one internal; the other, external. Although it will be possible to board at any time using camouflage because the big picture has given us a go-ahead to trade with a bullish bias, no big-picture ‘mechanical’ entry will be possible until such time as April Gold pulls back from within the range p=1367.50 – 1384.00 (or s0). _______ UPDATE (March 27, 9:35 p.m.): Gold futures got no lift whatsoever when the stock market reversed and began to plummet. This was not merely disappointing, it was dismal. I cannot say what is ailing gold at the moment, but after today’s leaden performance, we can only infer that bullion quotes will fall over the near term. The pattern shown in this chart does not yet have a point ‘C’ high, but once one occurs, you can use it to project support levels for the next leg down.
