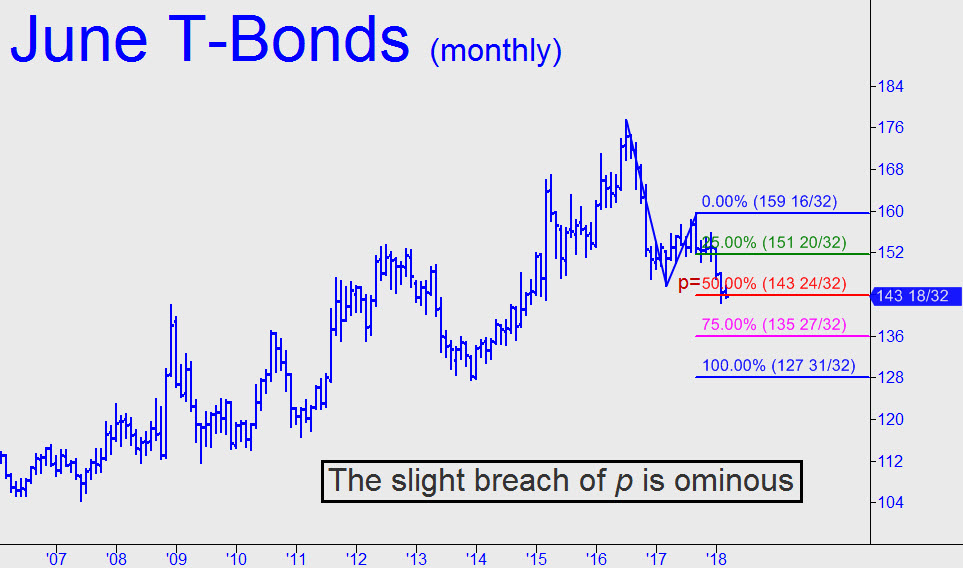
 Lately I’ve focused mainly on what T-Bond futures would need to do to get out of serious jeopardy. A rally to 147^27 would be a good start for the March contract. But suppose the next big move is down, not up. The new chart shows that the June contract could fall all the way to 127^31 in search of a solid bottom. That would equate to a rate of 3.75% on the 30-year, currently trading around 3.13%. I cannot predict what the U.S. and global economies might look like if that were to occur, but it’s a pretty good bet that the housing and auto sectors would be in a deep funk. Wouldn’t the implied recession bring rates back down? Indeed it would, although it might take an extremely steep plunge in economic output to cause this to occur. For me, at least, the scariest thing of all is my very long-term target for interest rates on long-term Treasuries. I’ve projected 0.6% (!), but I would not deign to predict what the economy would look like at that point. Point-six percent on the Long Bond — and, correspondingly, zero-point-zero on the Ten-Year — are not so farfetched if you can imagine every investor on the planet fleeing to ‘quality’ in the space of just a few weeks. _______ UPDATE (March 13, 10:53 p.m. EDT): A rally to the 145^05 target shown is in-the-bag, but the short-to-intermediate-term picture would brighten even more if bulls can close this vehicle above that number for two consecutive days or trade more than six ticks above it intraday. ________ UPDATE (March 14, 7:14 p.m.): The futures rallied to within a tick of the 145^05 target I’d proffered here yesterday as a lock-up. To be certain the rally isn’t just a flash-in-the-pan, let’s set a high bar for bulls. Specifically, we’ll stipulate that They hoist this vehicle above the twin peaks shown in the chart. The higher lies at 147^05, and that’s where I would suggest you set a screen alert if you’ve been waiting patiently for Treasury Bonds’ long, painful dirge to end. _______ UPDATE (March 27, 10:44 p.m.): The June contract’s easy move past the rally target shown is quite bullish. The next Hidden Pivot resistance above it lies at 146^05, but if buyers can push past it, then past a peak at 146^21 recorded on February 6, that would add to the evidence that a major upturn is under way.
