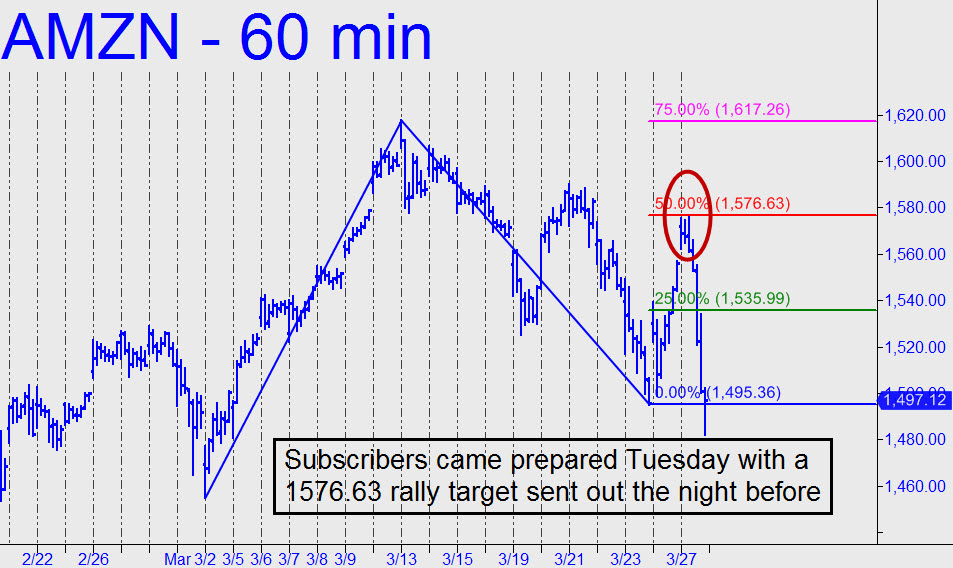
 Today’s exhilarating reversal took bulls and bears alike by surprise when, instead of reversing on short-covering in the final hour, sellers quickened their tempo until the closing bell. The chart shows why we have put so much faith in Amazon to tell us what is on the fevered brains of its institutional sponsors at any given moment. Ricks Picks subscribers began the day with 1576.63 rally target that lay $20 above Monday’s close. In the actual event, Amazon surged overnight to within 66 cents of the target before plummeting $93 intraday. Put options that could have been purchased for as little as $2 on the opening fetched as much as $41 later in the session. The stock ended the day pennies from the 1482.59 target shown in this chart. If it gives way, the next place I would look for a bounce is 1464.89, [Note: This number, originally given as 1463.41, has been corrected.] a Hidden Pivot support derived from these coordinates on the hourly chart: a=1606.44 on 3/14; b=1495.36 on 3/23. _______ UPDATE (March 28, 7:10 p.m.): Ordinarily I would be cynically dismissive of AMZN’s plunge today, since it came on supposed news that we’ve heard before — i.e., that Trump thinks Amazon is too powerful and that he wants to ‘do something’ about it. But what if investors were to dismiss the sell-off as a con-job engineered by the usual sleazeballs to shake loose some bargain shares? That would make them bullish right now — the moreso if the stock were to reverse this week’s steep slide and start looking like its old world-beating self again. I am going to keep these crazy thoughts foremost in my mind if AMZN seems to revive with vigor. I can’t think of a more effective way for Mr. Market to trap bulls in the overpriced shares of an admittedly great company. It wouldn’t be the first time that bottom-line earnings eventually came to matter. _______ UPDATE (April 1, 5:10 p.m.): AMZN’s talented handlers set the stock up for a powerful short squeeze on Friday with an opening bar low that lay $64 beneath the previous day’s close. Buyers showed fatigue just beneath a rather large gap, but I doubt there will be a problem getting past it with bears evidently so badly trapped. The bearish pattern shown has already been used up, but I have no trouble imagining a rally to the red line, a midpoint pivot at 1520. Alternatively, if AMZN should fall in the early going, look for a turn from very close to 1410.12, a midpoint HP support using these coordinates on the 60-minute chart: A=1455.90 on 3/28; B=1365.20 on 3/29. ________ UPDATE (April 2, 12:56 p.m.): The stock dove on the opening bar, falling 86 points to a so-far low at 1361.00. This is speculatively bullish because 1361.00 is — to the exact penny — the midpoint pivot of this pattern on the hourly chart: A=1375.97 (3/27); B=1386.17 (3/28). The bad news is that if the stock, which has bounced $31 so far, relapses and decisively breaches the pivot or closes below it for two consecutive days, it will be signaling more downside to exactly 1265.42.
