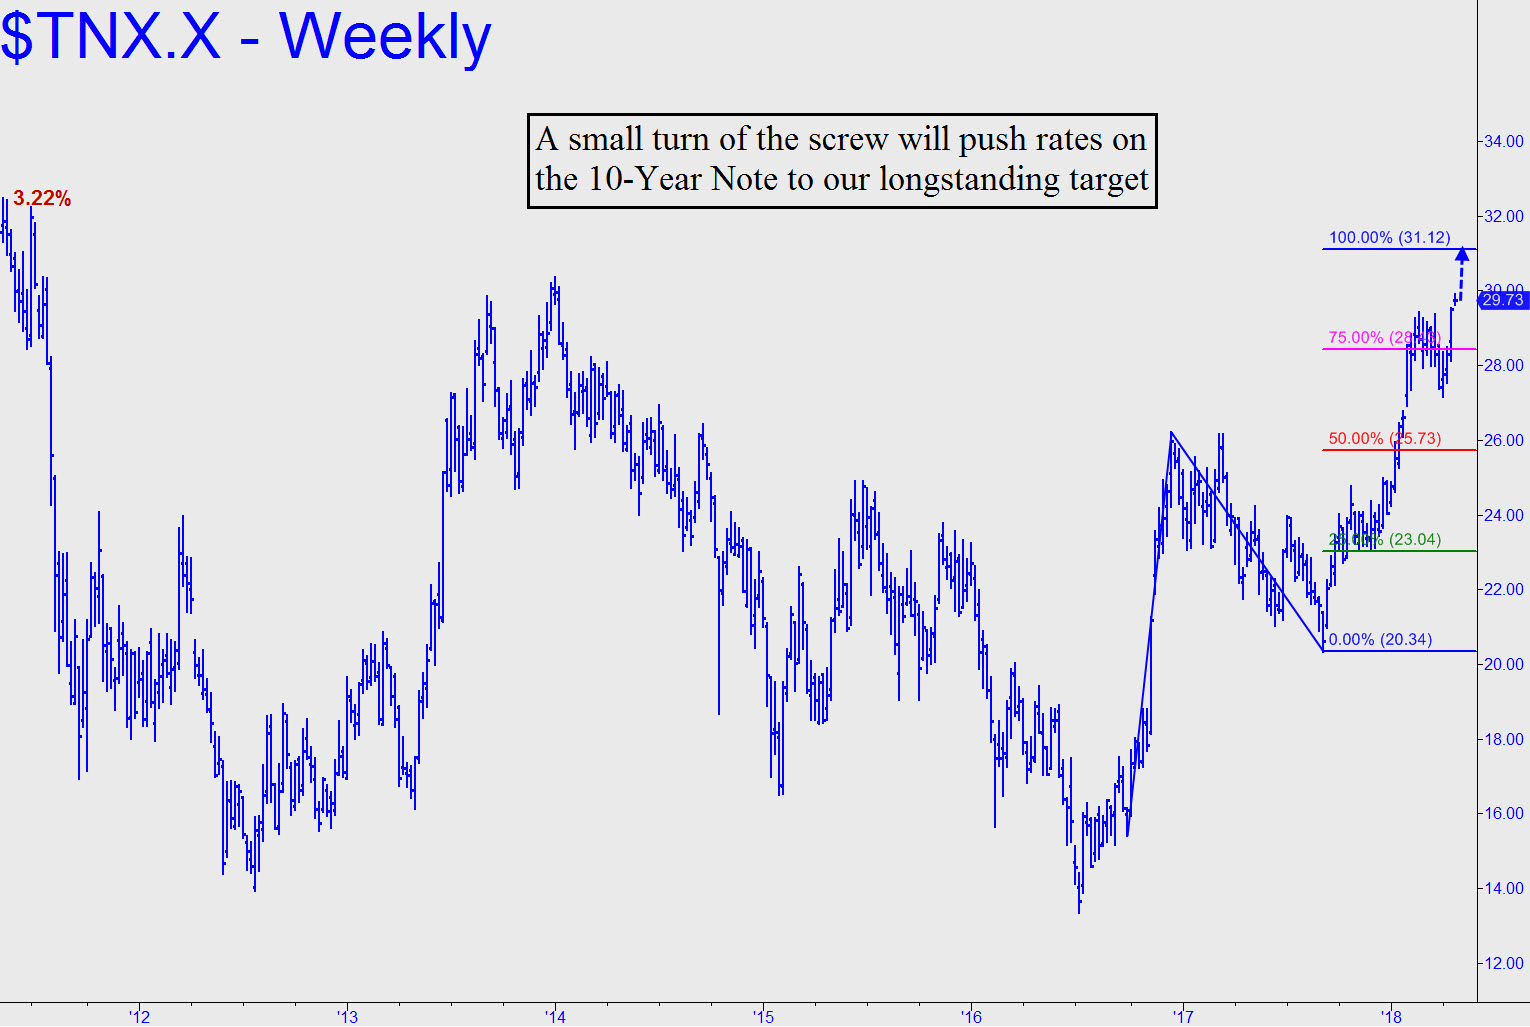
 It was back in December, when rates on the Ten-Year Note were hovering around 2.35%, that I first projected a move to as high as 3.11%. Now, just a small turn of the screw will satisfy that target. Some seers have said that anything above 3.00% will turn the economy to sludge, but I’d prefer to see a little higher — perhaps 3.25% — before I blow taps for the aging bull market. Notice the ‘external’ peak at 3.22% near the leftmost edge of the chart. If it is surpassed by the same upthrust that reaches our 3.11% target, the move would be warning bond bulls to stay out of the way. It would refresh the impulsive energy of the weekly chart, implying significantly higher yields and lower prices for T-Bonds and Notes. ________ UPDATE (May 20, 6:53 p.m.): The Ten-Year rate has pulled back, moderately so far, after topping last week within 0.05 points of the minimum upside target I drum-rolled here six months ago. It may be a little while before we can determine whether the top will turn out to be a very important one, but my gut feeling is that still higher rates are coming — enough to put a good choke-hold on the U.S. economy. _______ UPDATE (June 11): Recent price action in this vehicle on the daily chart has signaled a second leg down, presumably to at least 2.81%, the pattern’s midpoint Hidden Pivot. As always, crucial support lies precisely at this level, and its decisive breach would raise the odds of more slippage to d=2.63%.
