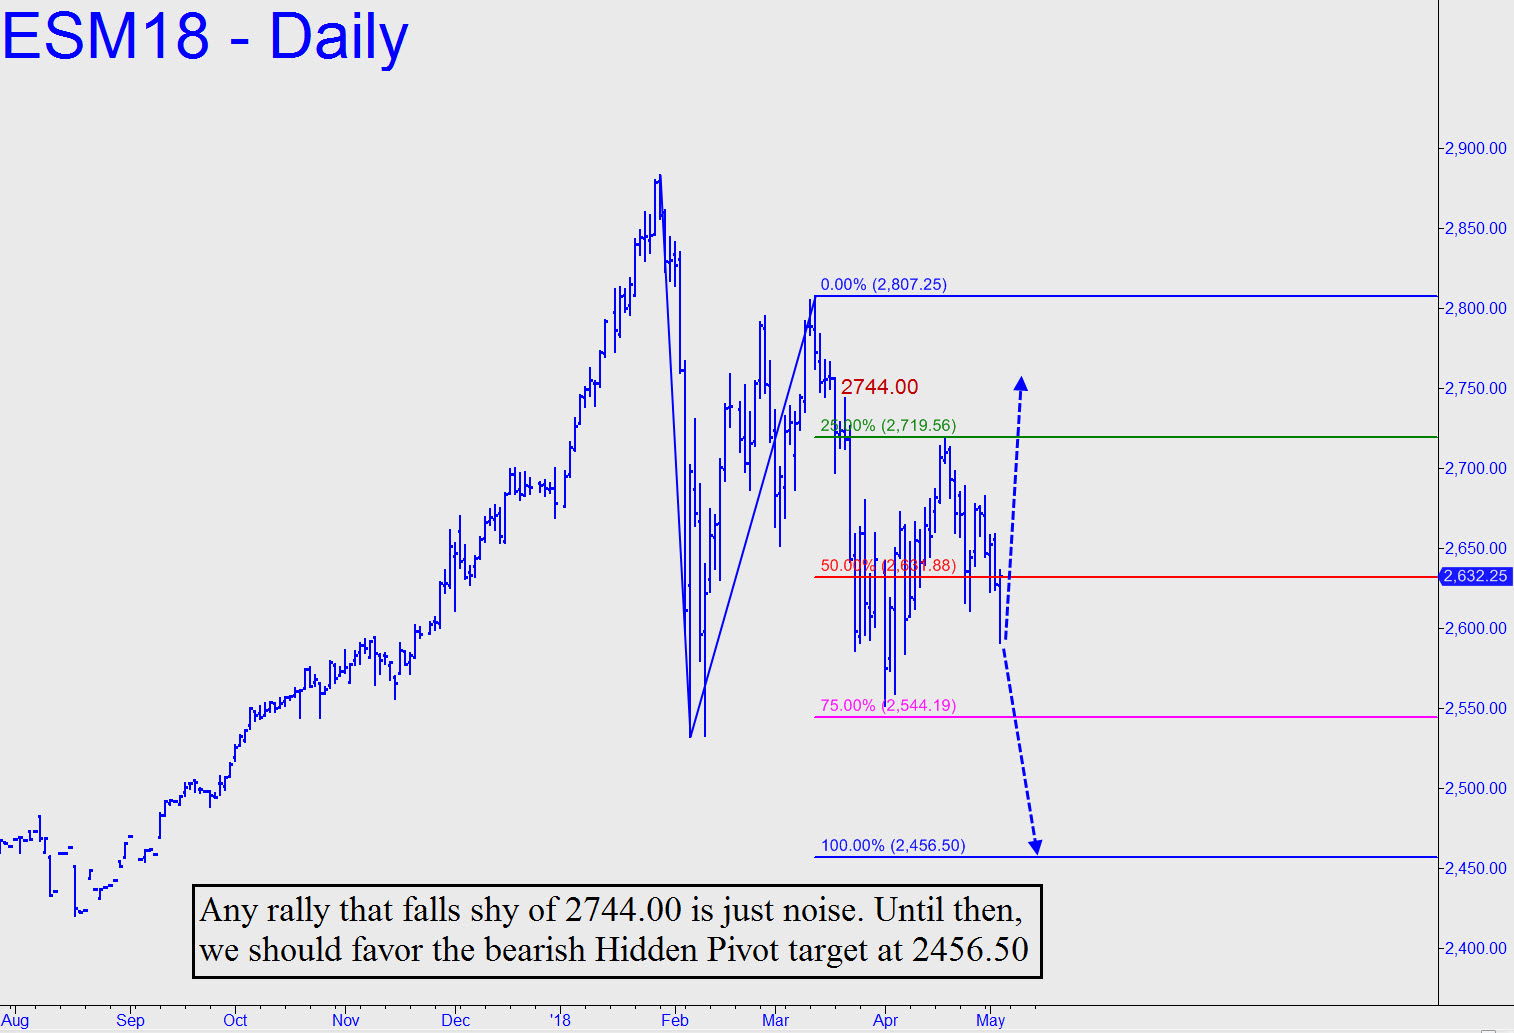
 I’ve lowered my bear-market target to 2456.50 because I was not comfortable with the original target at 2526.50. It required the use of a one-off point ‘A’ high that simply doesn’t look right on the daily chart. The one shown uses what I refer to as a ‘marquee’ high, but I think it has a good chance nonetheless of nailing the exact bottom of the bear cycle begun in late January. The swings on the hourly chart have been tradeable, but not according to any Hidden Pivot logic that I would warrant as easy or obvious. You can try tightly stopped bottom-fishing at 2575.00, but that’s all I am able to suggest for now (60-min, A=2718.00 on 4/18; B=2611.25 on 4/25; C= 2681.75). _______ UPDATE (May 6, 5:07 p.m. EDT): The hourly chart turned bullish as last week ended, with the futures bound, apparently, for a minimum 2724.50 (A=2584.50 on 4/6). However, as the chart above makes clear, any rally that falls shy of the 2744.00 peak recorded on March 21 should be regarded as mere noise. _______ UPDATE (May 7, 89:08 p.m.): Pivoteers, please take note: Today’s rally topped midway between p and p2 of this pattern, implying that a pullback to the green line would offer an excellent ‘mechanical’ buying opportunity. If geopolitical news heats up, though, be aware that leaving a bid at the green line could be especially risky.
