
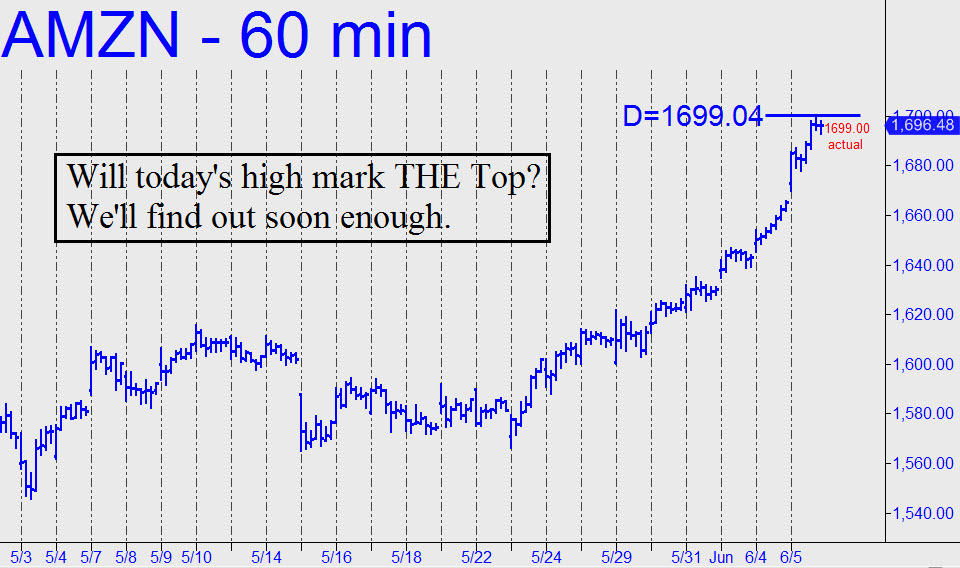
 AMZN topped Tuesday four cents from a potentially very important target at 1699.04 that I’d drum-rolled back in April. The stock was trading $240 lower at the time, but this technically derived ‘Hidden Pivot’ was so clear and compelling that it seemed almost certain to be achieved. Why the emphasis? AMZN had long since become a mantra for me — the General Motors of this era, but with far more importance to the U.S. economy. The firm operates on a vast scale globally and has demonstrated convincingly that it can dominate any market in which it chooses to compete. Web services, for one. Were you aware that this is a multi-trillion dollar ‘niche,’ and that Amazon has been crushing the second biggest player, Microsoft? Well, it’s a fact. The company is so good at what it does that it may even figure out how to make money selling groceries. In the meantime, it can continue to generate epic cash flow by remaining the dominant seller of all things online. Amazon currently accounts for 45% of e-commerce sales and its share of U.S. retail sales is around four percent. You can bet that CEO Bezos is hard at work figuring out how to double that number.
One Thing Is Perfectly Predictable…
All of which should tell you why I monitor AMZN’s charts so closely, and why I am spotlighting the 1699.04 target now that it has been achieved. It could be straight down from here. My initial outlook had noted that the 1699.04 Hidden Pivot resistance would seem impenetrable, at least on the first try. We should know by the end of the week, if not sooner. But if the stock should drop $100 or more over the next day or two, we should take this very seriously, since it may be signaling the end of the bull market in stocks begun in March 2009. Alternatively, if AMZN forges higher, closing above the 1699.04 pivot for two consecutive days or trading more than $60 above it intraday, I’d infer that it’s on its way to $2000 (with a corresponding 300-point rally in the S&Ps forecast here a few days ago). I’ll want to see the rally microscopically corroborated in charts of of smaller degree, however, since it is virtually impossible for any trend to change direction without telegraphing the reversal on the one-minute bar chart. Indeed, it is perfectly predictable that this bull market, as all bull markets before it, will end with a downtrending abcd pattern on the one-minute chart. As long as we stay diligently tuned to such details we cannot be fooled. _______ UPDATE (June 6, 8:00 p.m. EDT): AMZN failed to follow through on Tuesday’s sharp rally, but the broad averages moved higher nonetheless. For now, use the 1732.11 midpoint resistance shown in this chart as a minimum upside projection. If this Hidden Pivot exhibits stopping power, that would give us a very precise handle on the stock’s rally moving forward._______ UPDATE (June 10, 11:56 p.m.): The stock appears to be topping $18 shy of the 1732.11 target. That may not seem like much relative to AMZN’s nearly $1700 price, but it’s sufficient that we should want to monitor this retracement diligently. If downtrending, minor abc patterns start to exceed their ‘d’ targets, that could be a warning that the selling is about to snowball. _______ UPDATE (June 12, 6:12 p.m.): Far from topping, AMZN pulled back into a shallow trough and now looks hell-bent on defenestrating any sellers who might happen to lie in its path. The 1732.11 target remains valid as a minimum upside projection for the near term, but we’ll need to see how the stock reacts with this Hidden Pivot before we can judge whether buyers are unstoppable._______ UPDATE (June 14, 11:05 p.m.): Like NFLX, FB and some other lunatic stocks, AMZN is just inches from an ‘interesting’ Hidden Pivot target. My advice for Friday is the same I proffered in NFLX: buy any puts you choose with the stock at the target, but don’t risk any more than you would on a big-odds Trifecta. _______ UPDATE (June 18, 8:18 p.m.): To put on a jackpot trade in this stock Friday, you’d need to have bought expiring calls rather than puts — as we did in NFLX — since AMZN greeted the day with a fakeout move lower, not higher. Just ahead of today’s opening, the stock looked bound for 1699.03. This pattern is very gnarly and uses overnight bars, so if you bottom-fish there, be delicate._______ UPDATE (June 18, 9:44 p.m.): I’m not getting strong vibes either way at the moment, although my bias is most surely bullish. Let’s see how the stock interacts with the 1728.74 pivot shown in this chart before we decide what to do._______ UPDATE (June 19, 7:32 p.m.): The head-butts at p were not as precise as we should like to see, but they’re close enough to suggest that the pattern shown is a good one. That means its 1784.46 target will be well in play if the stock can close for two straight days above 1728.74, or trade perhaps 1740 or higher intraday._______ UPDATE (June 20, 8:52 p.m.): Buyers smoked every offer in sight, shortening the odds of a continuation to the 1784.46 target.