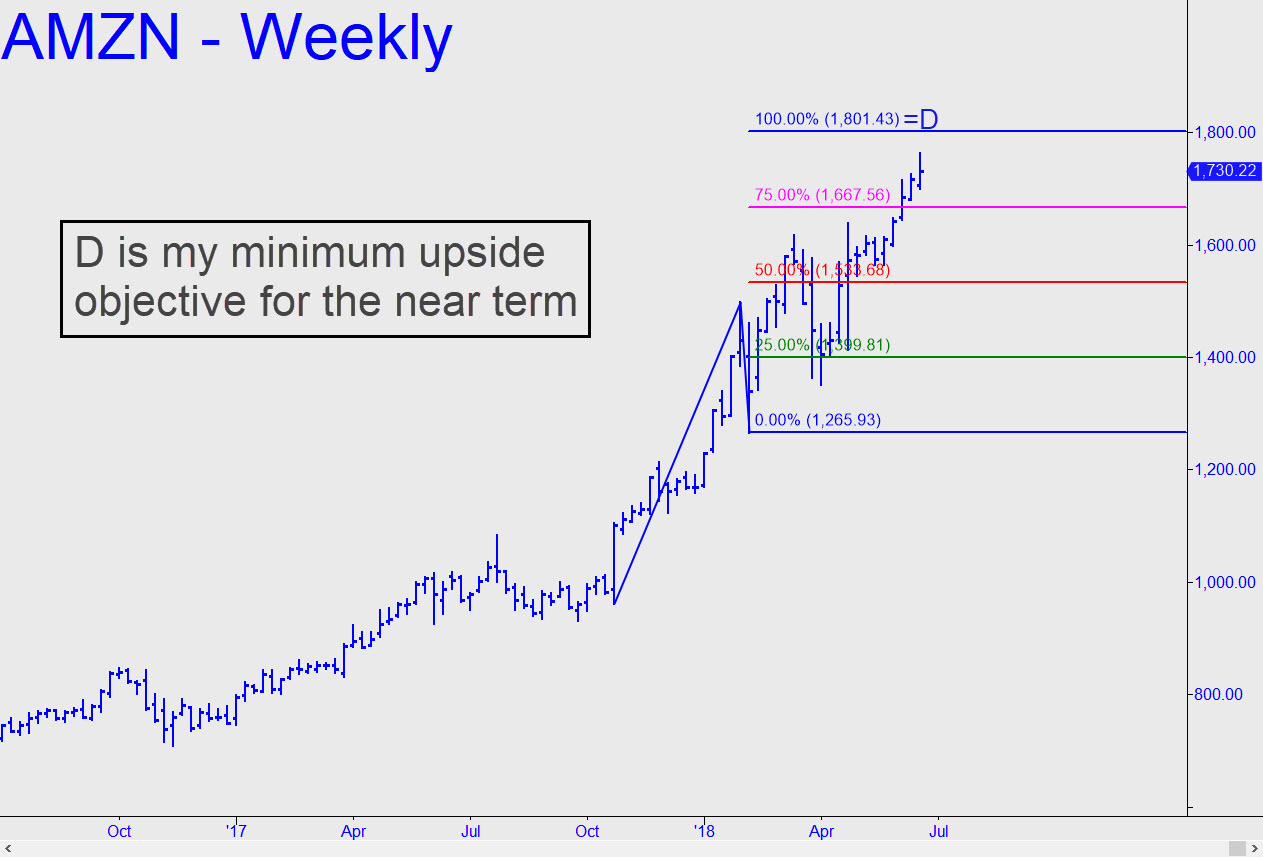
 There are numerous bullish targets in play, making it challenging to pick a logical spot for AMZN to top. That is not our game, however; we are more interested in minimum upside projections that will allow us to trade with a bullish bias up until the very threshold of danger. In that regard, I will warrant the 1801.43 Hidden Pivot shown as a reliable objective for any trader who wants to continue surfing the trend. The stock could stall there or even create a major high. But if buyers blow past it, the next rally objective likely to be achieved would be 1832.18. (This ‘hidden’ resistance is calculated by simply sliding the point ‘A’ low down to September’s 931.85 bottom four bars to the left of the one shown.) Usually, shifting to the hourly chart produces precise clarity for very short-term forecasts. In this case, the 60-minute bars leave us hanging on a cliff, since they show a possible top at 1769.10; Thursday’s actual high was 1763.95. Although that may sound close enough for government work, Pivoteers have been given to expect a more exact ‘hit’. Even so, it’s sufficiently close that we shouldn’t be surprised if AMZN comes down hard from here. ______UPDATE (June 24, 9:47 p.m.) DaBoyz have opened AMZN on short-squeeze gaps on the last two days, creating more than a faint whiff of desperation. Whatever they are feeling, odds have grown that last week’s high, which fell a tad shy of our target, may have been an important one. For now, use the 1698.10 target shown as a minimum downside objective for the near term. If it gets crushed, that would reinforce my already mildly bearish bias. _______ UPDATE (June 25, 2018): Today’s relentless selling breached two ‘external’ lows on the daily chart. This generated a potentially powerful impulse leg that could signal the start of a major correction. The last time a similar event occurred was nearly a year ago, in August 2017. In the months that followed, it led to a major low from which AMZN, then trading for around $950, nearly doubled in price. No one could confidently infer that this impulse leg will similarly lead to a doubling in price, to around $3300. Hidden pivots aside, there is structural support in the range 1570-1620. The stock is all but certain to test it, so let’s sit back, watch and enjoy the show. If AMZN trades below the range within two weeks of entering it, I’d infer that significantly lower prices are coming.
