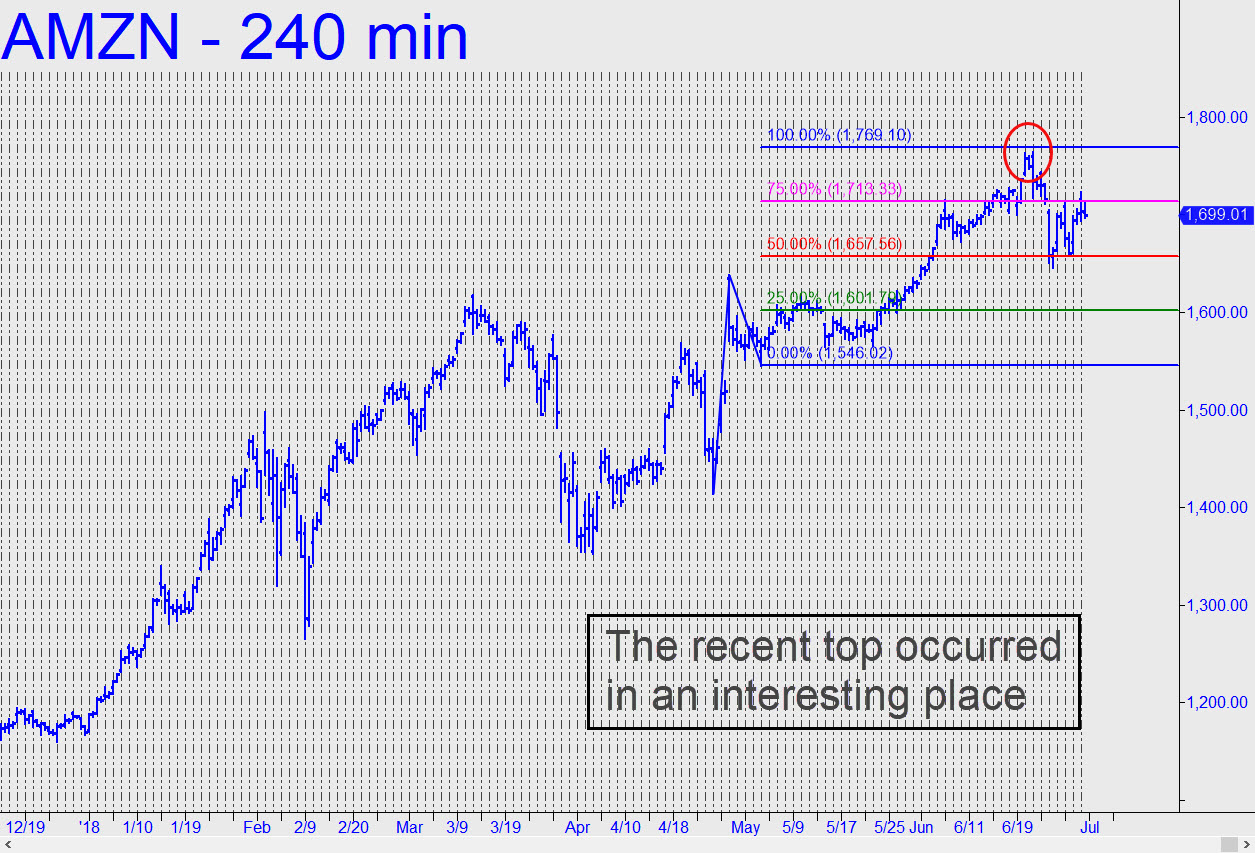
 The recent high occurred in an interesting place — i.e., just shy of a clear and compelling Hidden Pivot resistance at 1769.10. On the chart shown, it looks like bulls missed the target by a hair. The actual shortfall was about $5, however, and that was enough to strand our timely bid for puts just before the stock plunged 118 points, or about 6%, in just two days. It took AMZN nearly two months to trace out the bullish ABCD pattern that got it to the target, so we might expect the stock to take at least 2-3 weeks before it could attempt a run-up to new record highs. This will leave it vulnerable to a second corrective leg that could send the stock down to as low as 1605.77 by week’s ends. We’ll keep watch for now, but stay tuned to the chat room in case an opportunity develops to buy out-of-the-money put options for a bargain price. _______ UPDATE (July 2, 8:01 a.m.): Overnight weakness has given authority to the pattern shown; it is the one that produced the 1605.77 target noted above. For now we can use its 1664.59 midpoint Hidden Pivot as a minimum downside objective._______ UPDATE (July 2, 5:15 p.m.): Bears never stood a chance after AMZN’s world-class handlers gapped the stock down $21 on the opening bar. It was up, up and away thereafter, the fruits of a short-squeeze that should have little trouble achieving the 1737.16 target shown in this chart. _______ UPDATE (July 4): I may have overestimated the bullish intentions of AMZN’s handlers, since they gapped the stock $9 higher on the opening in order to distribute it to the rubes. This is not bullish price action, but I won’t even hazard a prediction as to what it implies for trading ahead of the weekend. It’s going to be volumeless, but it will also feature the first official institutional buying for Q3._______ UPDATE (July 5, 5:35 p.m.): Another bull-trap opening that stinks of distribution. Even so, selling continues to dry up at well-controlled lows, suggesting the stock’s cagey handlers could move it $15 in either direction with no change in underlying supply/demand.
