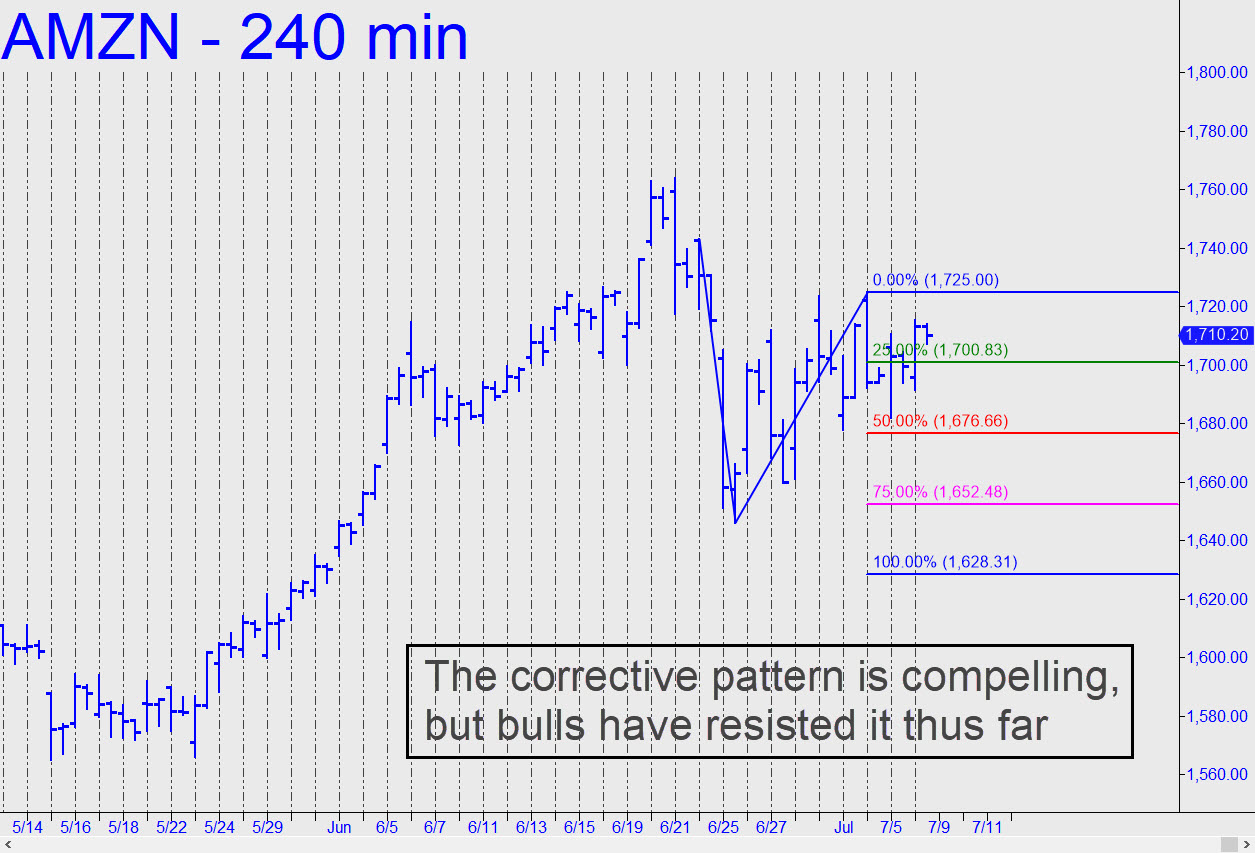
 The bearish pattern shown looks almost too pretty to fail, implying we should expect the stock to fall eventually to 1628.31. In this case ‘fail’ would mean head-faking above 1725.00 before the bottom drops out; or alternatively, continuing higher to at least 1745.12, or perhaps even 1843.92. Those are Hidden Pivots associated with a large, bullish pattern begun on May 23 from 1566. What make me reluctant to sound the alarm is that AMZN tried unsuccessfully last week to take out two midpoint supports, including the one at 1676.66 shown in the inset. The first time, it bounced from the pivot precisely and rallied to stop out the pattern. Then, two days later, on Thursday, the stock began a rebound, still continuing, after not quite falling to the midpoint support of a subsequently created pattern. Both occurrences are mildly bullish. My guess is that Monday’s price action will bring decisive clarity to the short-term picture. Specifically, a breach early in the session of the 1676.66 pivot would probably clinch more downside to 1628.31. But if bulls hold their ground, going no lower than around 1690, short-covering is likely to push the stock above 1725.00 by no later than midsession Tuesday.
