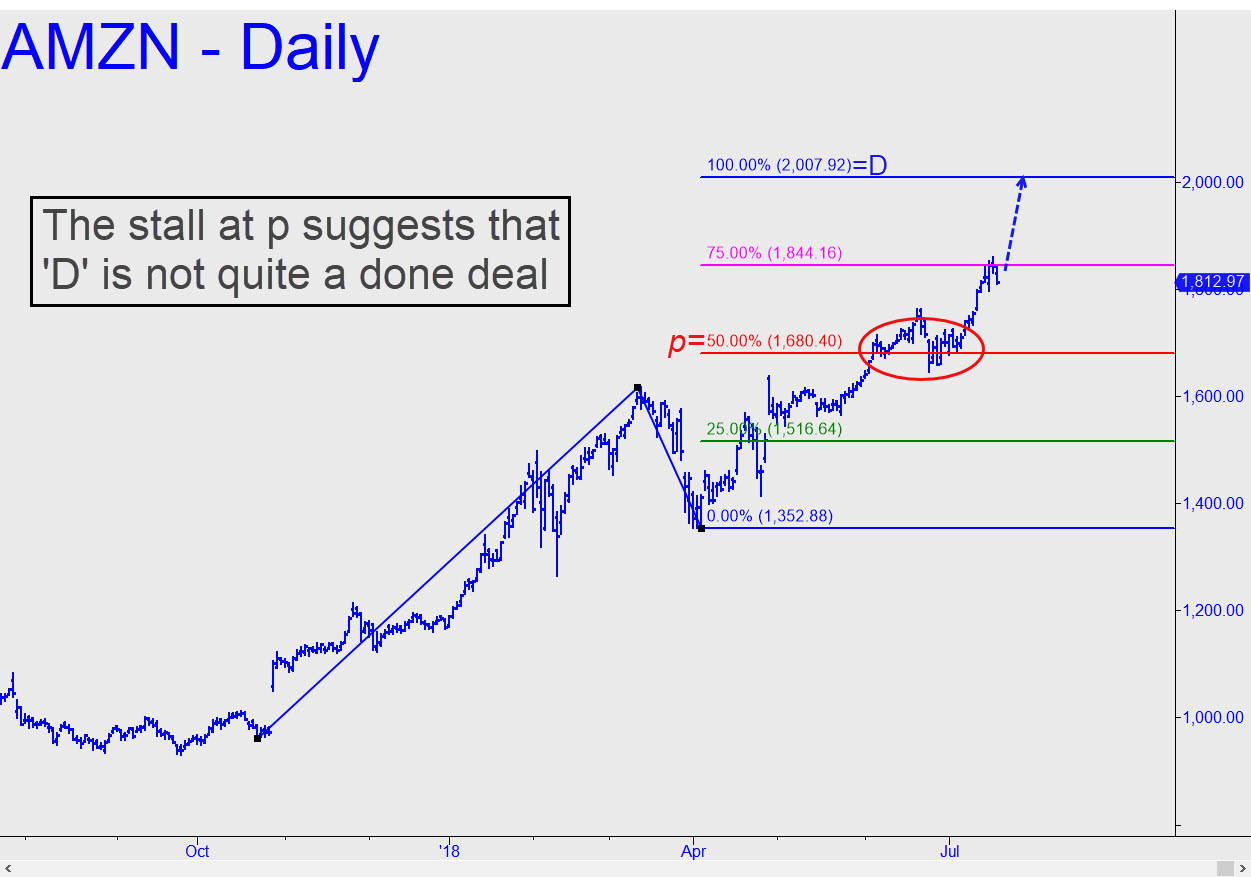
 AMZN seems destined to hit $2000, but today’s chart (see inset) provides a ‘Hidden Pivot’ target at 2007.92 to precisely inform our expectations. From a technical standpoint it’s not quite a done deal, however, since the stock struggled for more than a month to escape the gravitational pull of the 1680.40 ‘midpoint resistance’ shown. This is not necessarily a sign of weakness, but merely of hesitancy. AMZN doesn’t spend much time flailing around, but the chart makes clear that it did in fact stumble several times since early April. These are normal and necessary adjustments that have invariably produce the bullish wilding sprees that are AMZN’s trademark. Shares are up 56% since January, but we’ll need to take any stalls seriously because of the way buyers stalled at the midpoint resistance. That means that even the so far moderate selloff from Wednesday’s 1859 high could be the start of a more significant correction. Set a screen alert at 1797.37, since that’s where it would become mildly troubling. _______ UPDATE (July 23, 8:34 p.m. EDT): Short-term, AMZN looks ripe for tightly stopped bottom-fishing at the red line, a midpoint Hidden Pivot support at 1783.18. An easy breach of the support would portend more slippage down to as low as 1758.67. _______ UPDATE (July 24, 7:46 p.m.): Tuesday’s gap-up opening would have trapped quite a few bulls, but it didn’t scare them away for long. By late afternoon they were back in droves, pushing the stock toward the intraday high even though it had not even filled the gap created on the opening. For now, use p=1858.36 as a minimum rally target (daily chart, A=1682.15 on 7/5). _______ UPDATE (July 25, 8:30 p.m.) Buyers impaled the 1858.36 resistance, suggesting their appetite for more stock remains unsatisfied. The D target associated with this number is 1946.72, but I’ll need to see a couple of consecutive closes above the 1853 midpoint pivot before I regard the target as being in play.
